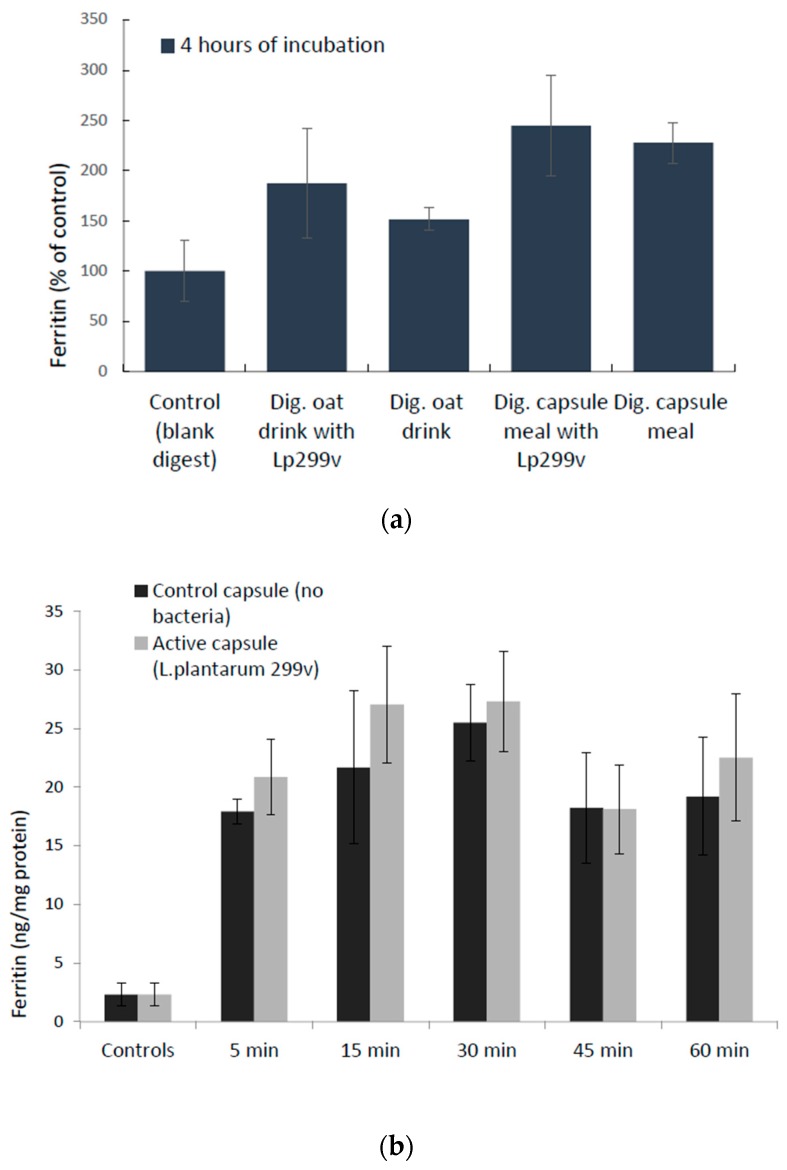
Figure 4.
Iron uptake (ferritin expression) in Caco-2/HT29 MTX cells. (a) Data are means ± SD, n = 3 for digested (dig.) oat drink trials and n = 2 for capsule meal trials; each trial was done in triplicates. The differences between the study products and their controls (no bacteria) were not significant. (b) Cellular ferritin levels in Caco-2/HT29 MTX cells in response to the content of iron capsules, with and without L. plantarum 299v. Data are means ± SD, n = 2, in which each trial was done in triplicates. The differences between active capsules and control capsules (no bacteria) were not significant.

