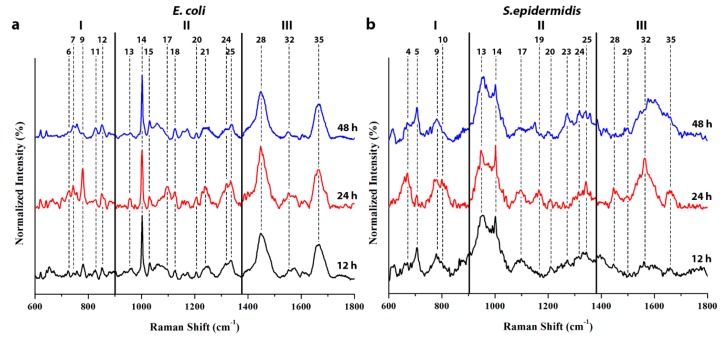
Figure 3.
SERS spectra of E. coli (a) and S. epidermidis (b) in the 600 to 1800 cm−1 range, collected after 12, 24, and 48 h of culturing. The spectrum was divided into three distinct zones (labeled zones I to III), while the band frequencies were labeled according to Table 1.

