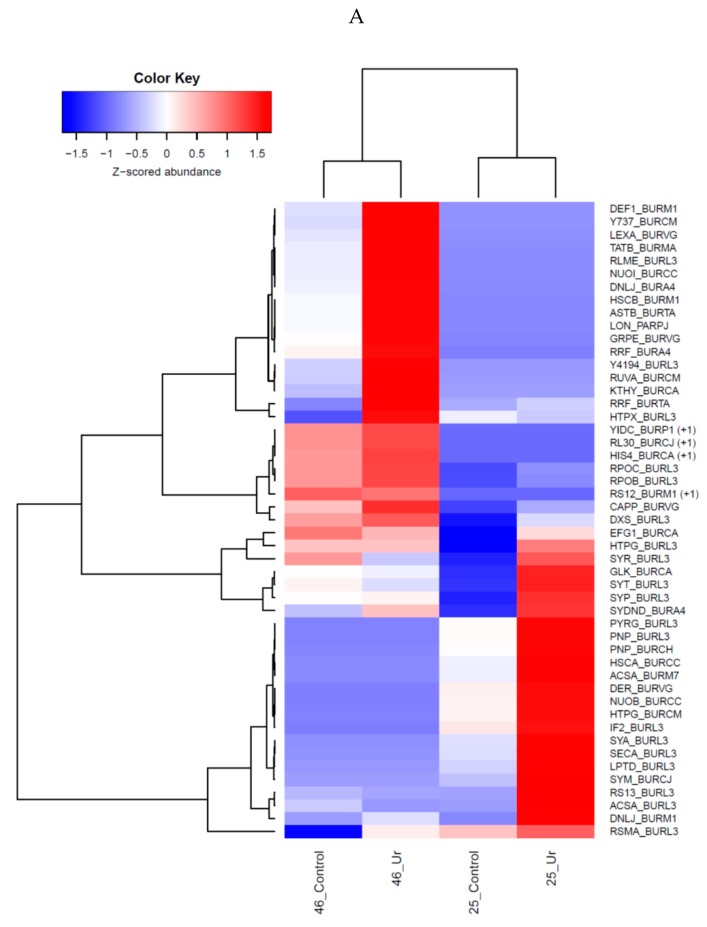
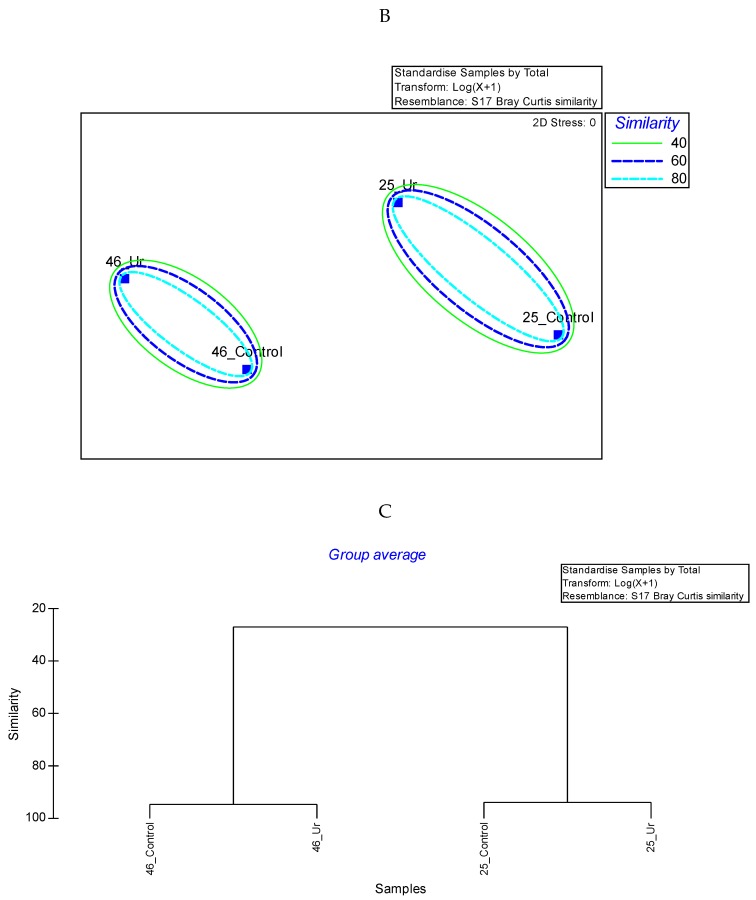
Figure 7.
Shown is the heatmap obtained from Burkholderia sp. strains 25 and 46 with top 50 proteins by fold-change from either of the two strains plotted to show their distinctions observed between controls and uranium exposure (A). Gradient of fold change is shown by color code, where blue represents the lower most fold change value and red represents the highest fold change value. Parenthesis in yellow and green color represents those proteins that were identified as over-represented in strains 25 and 46; (B) Nonmetric multidimensional scaling (NMDS) ordination of all identified proteins from either strain; Bray-Curtis similarity values between are shown at the 40%, 60%, and 80% levels; and (C) Dendrogram based cluster analysis of the NMDS of total identified proteins. Data was standardized, transformed by log (X + 1) and resemblance matrix was calculated prior to plotting the NMDS and dendrogram.


