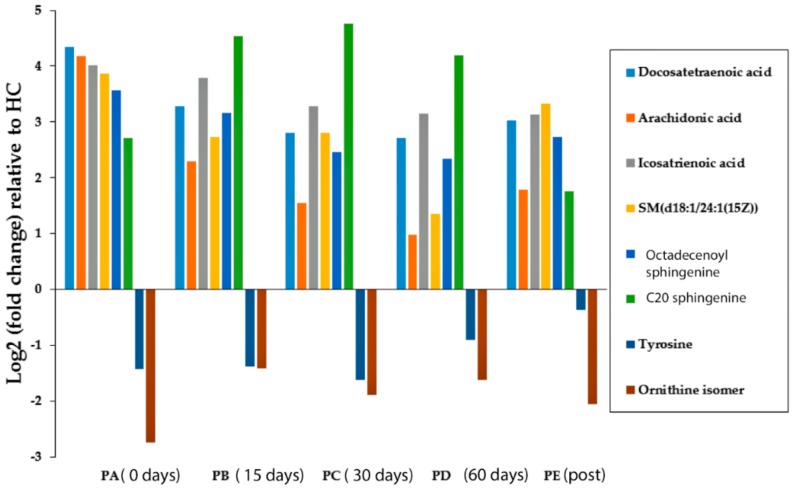
Figure 3.
Log2 of the fold-change in the eight differentiated metabolites in the CD groups (before, during, and after EEN treatment) compared with the group of healthy controls. (HC) Healthy control children, (PA) CD children pre-EEN treatment, (PB) CD children 15 days during EEN treatment, (PC) CD children 30 days during EEN treatment, (PD) CD children 60 days during EEN treatment, (PE) CD children back to a free diet.

