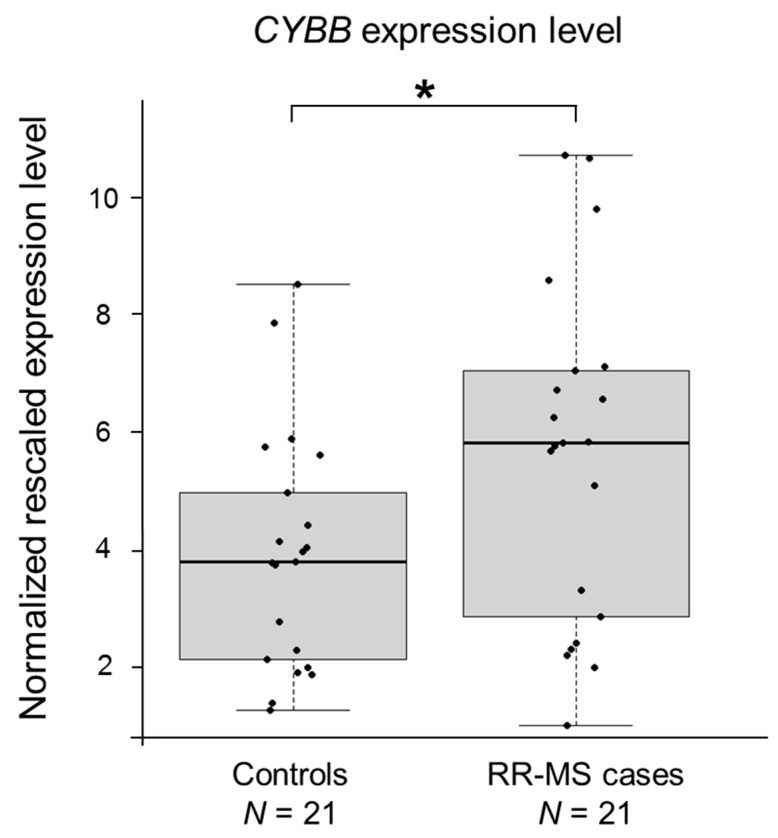
Figure 3.
CYBB is upregulated in MS patients. Boxplots show the expression levels of the CYBB gene measured by semi-quantitative real-time RT-PCR in PBMCs of an Italian case-control cohort (only female individuals). Boxes define the interquartile range; the thick line refers to the median. Results were normalized to expression levels of the HMBS and ACTB housekeeping genes and are presented as rescaled values. The number of subjects belonging to each group is indicated (N). Significance levels of t-tests are shown. * p < 0.05.

