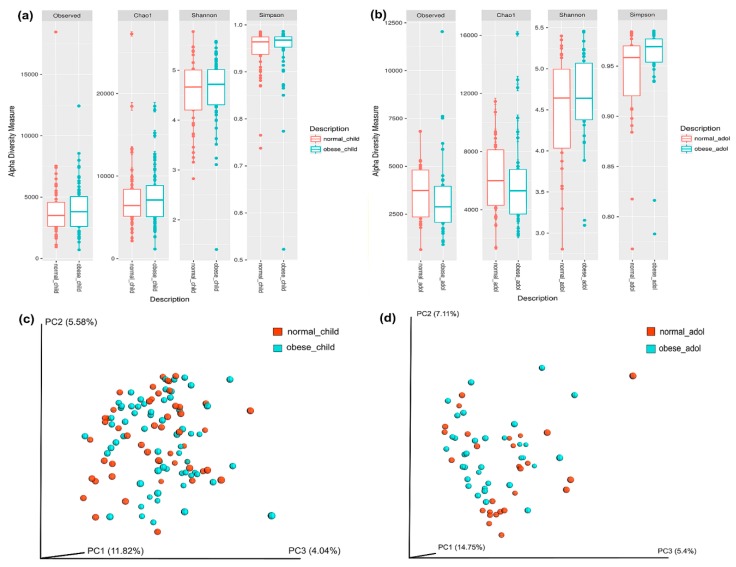
Figure 1.
Characterization of alpha-diversity of the gut microbiota in children (a), and adolescents (b). The y-axes show the Observed numbers of species, Chao1 richness index, and the Shannon and Simpson diversity indexes. The x-axes show the phenotypic categories. Additional data are in Table S2. The gut microbiota beta diversity of normal weight and obese individuals in children (c) and adolescents (d), was calculated by dissimilarity metrics using operational taxonomic unit (OTU) tables and Unweighted UniFrac analyses. The analysis shows the dissimilarity between normal weight and obese individuals. Three-dimensional scatter plots were generated using principal coordinates analysis (PCoA). Tags beside the graphics are normal weight children, obese children, normal weight adolescents, and obese adolescents. Normal weight individuals are shown in orange, and obese individuals are shown in blue color. Data were analyzed as described in the Materials and Methods section.

