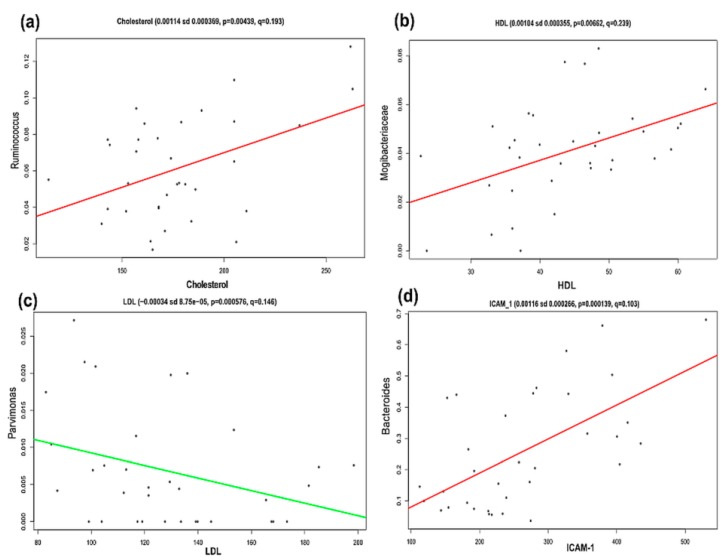
Figure 5.
Multivariate linear associations of clinical metadata and bacterial relative abundance in obese adolescents. Scatter plot explains the significant association of Cholesterol with Ruminococcus (a), HDL with Mogibacteriaceae (b), LDL with Parvimonas (c), and ICAM-1 with Bacteroides (d), as described in Materials and Methods section and Table S7. p-values and FDR corrected q-values are assigned by MaAsLin (v0.0.4). y-axes show the relative abundance of gut microbiota; x-axes show the clinical metadata. Numerical data on top of each graphic are Coefficient (positive coefficient shows positive association, and negative coefficient shows negative association between metadata and gut microbiota), sd—standard deviation; e—times 10 is raised to the power of; p-values, and FDR corrected q-values which are assigned by MaAsLin (v0.0.4). HDL—high-density lipoprotein; LDL—low-density lipoprotein, and ICAM-1—intercellular adhesion molecule-1.

