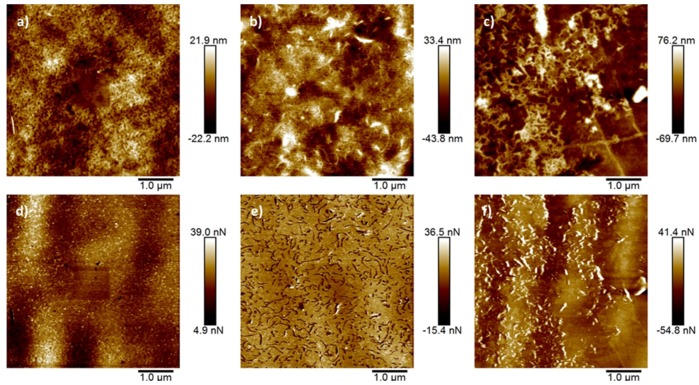
Figure 3.
AFM images of PS membranes: (a) height image of pristine PS (root mean square roughness (Rq) for this image = 6.47 nm); (b) PS with commercial CNTs (Rq = 12.9 nm); (c) PS with produced CNTs (Rq = 25.6 nm); (d) adhesion map of pristine PS obtained simultaneously with image (a); (e) adhesion map of PS with commercial CNTS corresponding to (b); (f) adhesion map of PS with produced CNTs corresponding to (c).

