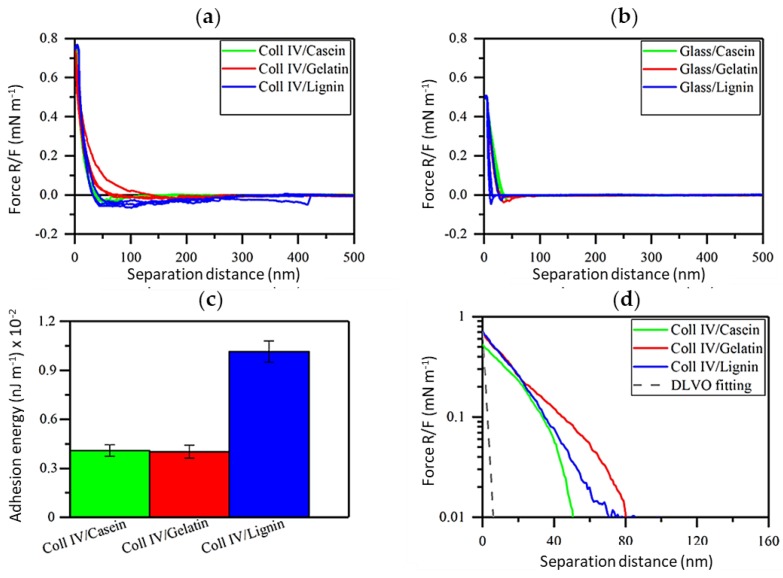
Figure 5.
AFM force profiles. Interaction between (a) Col IV probe and other proteins and lignin. (b) Interaction of the model surfaces with a neat glass probe. (c) Corresponding histograms of mean adhesion energy of above interactions including standard deviation. (d) DLVO fitting of the data presented in (b). The gray dashed line represents the DLVO fitting for PBS (150 mM) at pH 7.4. All force profiles were normalized with the radius of the probe.

