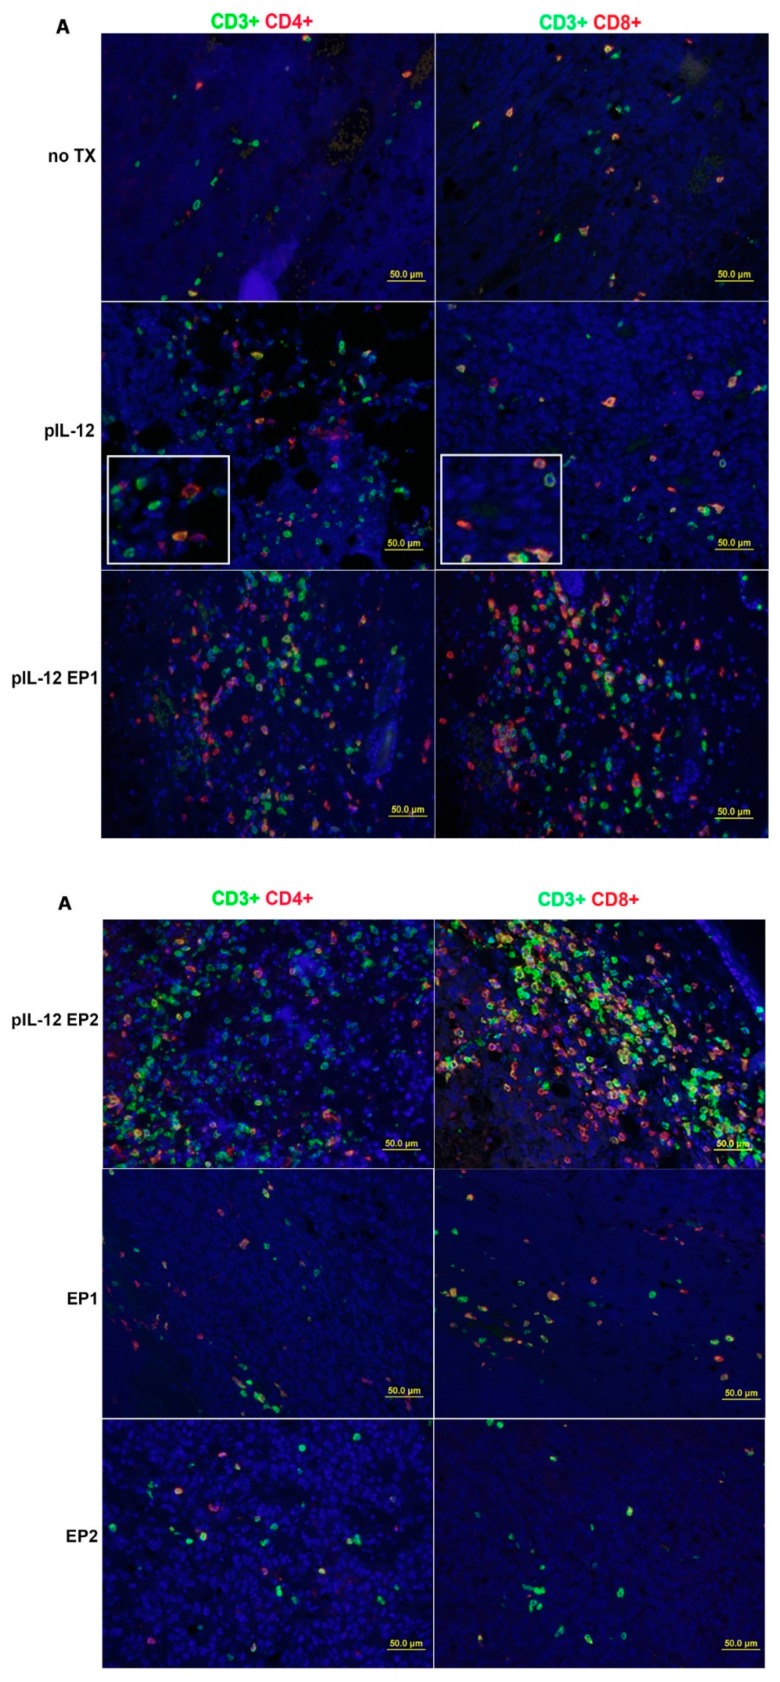
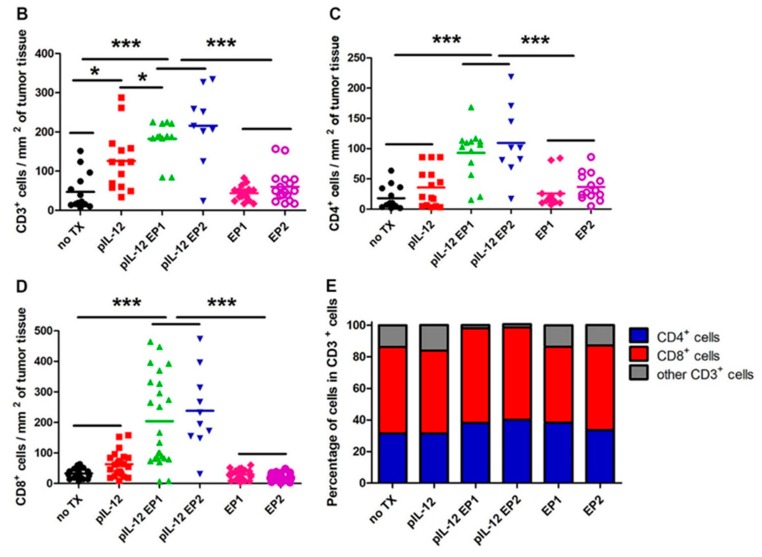
Figure 3.
pIL-12 GET enhances tumor infiltrating lymphocyte (TILs) density in the Tumor Microenvironment. (A) Tumors were collected on day 9 for histological analysis. Paraffin sections of tumor tissue were stained with anti-CD3, anti-CD4 and anti-CD8. Visualized by optical microscope (×200). (B–D) Representative immunohistochemical analysis of pIL-12 GET. The density of TILs was quantified in 10–20 random fields (number of total cells > 200). Horizontal bars indicate mean values. The data presented are representative of two independent experiments. (B) CD3+ density. (C, D) IHC data represented as the mean density of CD4+ and CD8+. (E) The percentage of CD4+ and CD8+ cells among total CD3+ cells. Each value represents the mean +/− SEM of the group. Pooled data from two independent experiments are shown. One-way ANOVA, p * < 0.05, p ***< 0.001.


