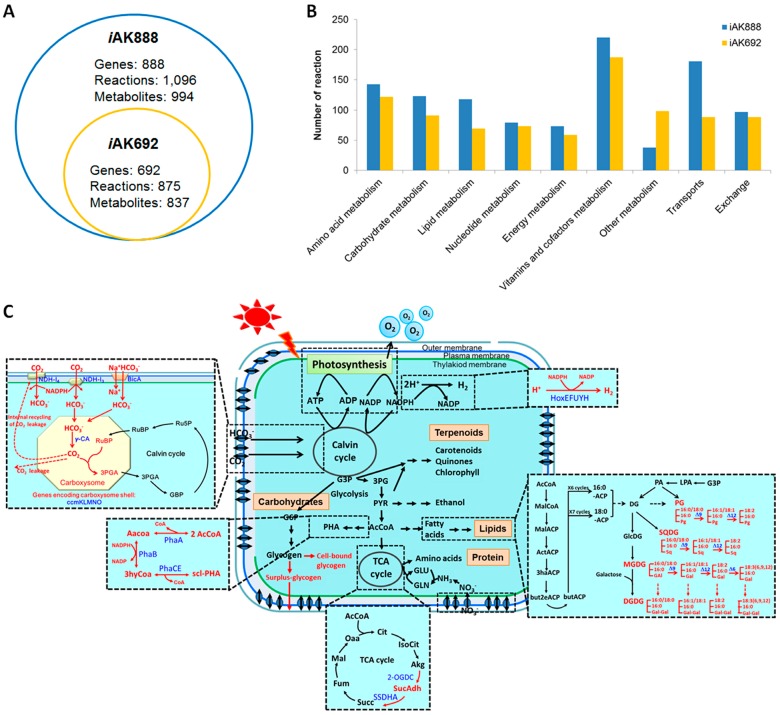
Figure 2.
Comparison between iAK888 and iAK692. Overview features of iAK888 compared to iAK692 (A). Number of reactions in each metabolism of iAK888 compared to iAK692 (B). Schematic representation of iAK888 and the example of the filled pathways compared to iAK692 (C). Zoomed out sections are pathways that were completed in iAK888. Red texts and arrows indicate missing pathways in iAK692.

