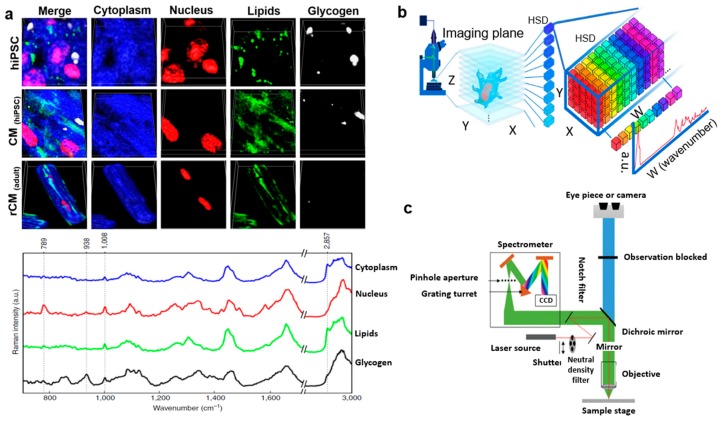
Figure 6.
Raman imaging of cardiac cells. (a) 3D visualization of representative human-induced pluripotent stem cells, cardiomyocytes, and adult rat ventricular cardiomyocytes (top), and representative Raman spectra (bottom) (excitation wavelength: 532 nm). (Reprinted with permission from [33]). (b) Graphic illustration of quantitative volumetric Raman imaging process, data collection, spectral unmixing, and 3D reconstruction of stem cells (excitation wavelength: 532 nm). (Reprinted with permission from [33]). (c) Standard configuration of an upright confocal Raman microscope (excitation wavelength: 785 nm). (Reprinted with permission from [34]).

