Figure 7.
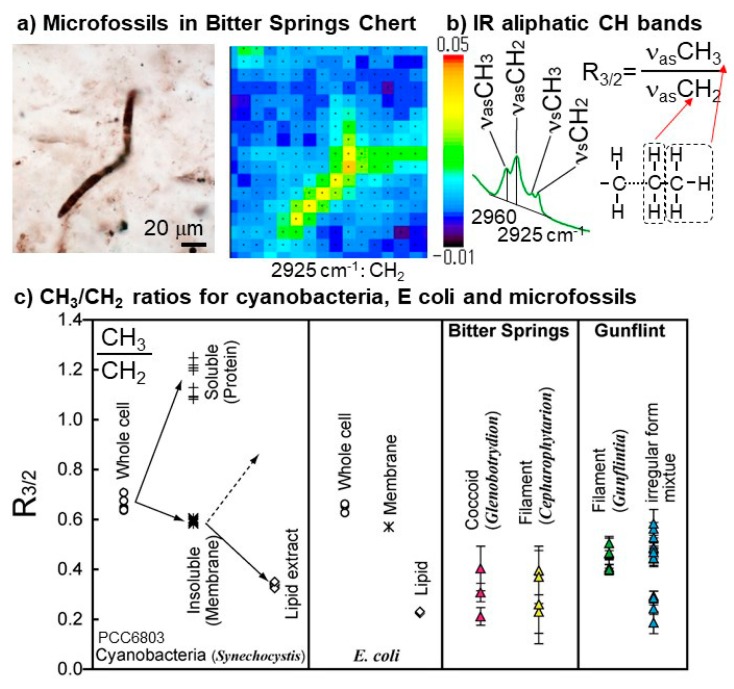
Infrared (IR) micro-spectroscopic analyses of microfossils. (a) Optical microscope image of a filamentous microfossil in Bitter Springs chert and IR map image for 2925 cm−1 peak height due to aliphatic CH2 modified from Igisu et al. [120]. (b) Schematic images for determining the CH3/CH2 peak height ratio (R3/2). (c) CH3/CH2 peak height ratio (R3/2) of extant prokaryotes (cyanobacteria and E coli), and microfossils from Bitter Springs Group and Gunflint Formation modified from Igisu et al. [121] with copyright permission from the journal. Values for the whole cell, water-soluble (proteins), water-insoluble (membrane), and lipid extracts are also shown for cyanobacteria and E. coli.

