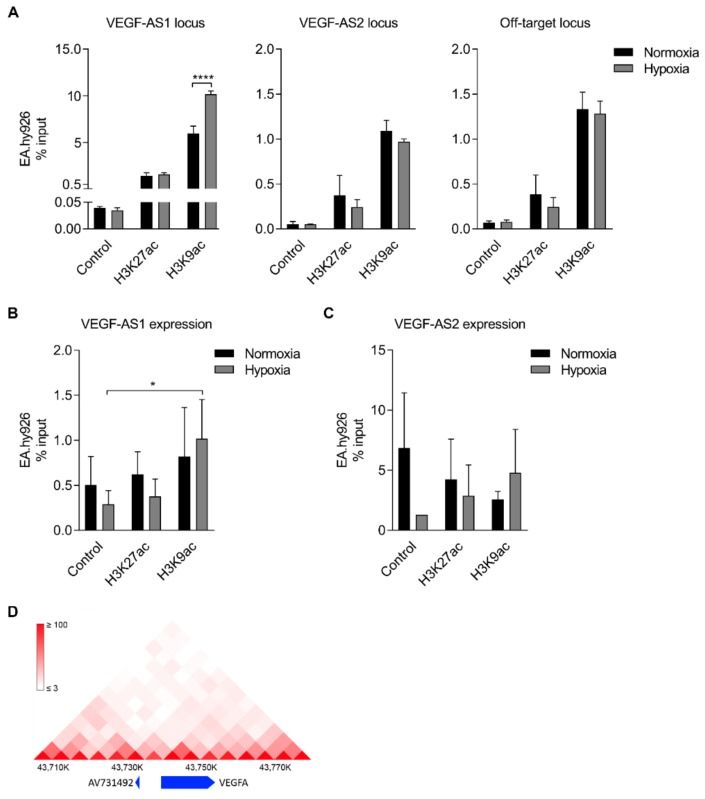
Figure 4.
Strong enhancer marks are associated with VEGF-AS1 and VEGF-AS2; (A) A qPCR analysis of H3K27ac and H3K9ac enrichment at the VEGF-AS1, VEGF-AS2 and off-target loci in normoxic and hypoxic EA.hy926 cells. IgG is used as a control. The data are presented as mean ± SD and standardized to inputs (n = 3 independent experiments). Significance was measured by two-way ANOVA. **** p < 0.0001; (B) A qRT-PCR analysis of H3K27ac and H3K9ac association with VEGF-AS1 in normoxic and hypoxic EA.hy926 cells. IgG is used as a control. The data are presented as mean ± SD and standardized to inputs (n = 3 independent experiments). Significance was measured by two-way ANOVA. * p < 0.05; (C) A qRT-PCR analysis of H3K27ac and H3K9ac association with VEGF-AS2 in normoxic and hypoxic EA.hy926 cells. IgG is used as a control. The data are presented as mean ± SD and standardized to inputs (n = 2–3 independent experiments); (D) the prediction of physical contacts between the VEGF-AS2 locus and the VEGF-A promoter in human umbilical vein endothelial cells (HUVECs). The figure was generated by using three-dimensional (3D) Genome Browser (http://biorxiv.org/content/early/2017/02/27/112268). The track around the VEGF-A gene loci was selected in 5 kilobase resolution in HUVECs with genome version HG19.

