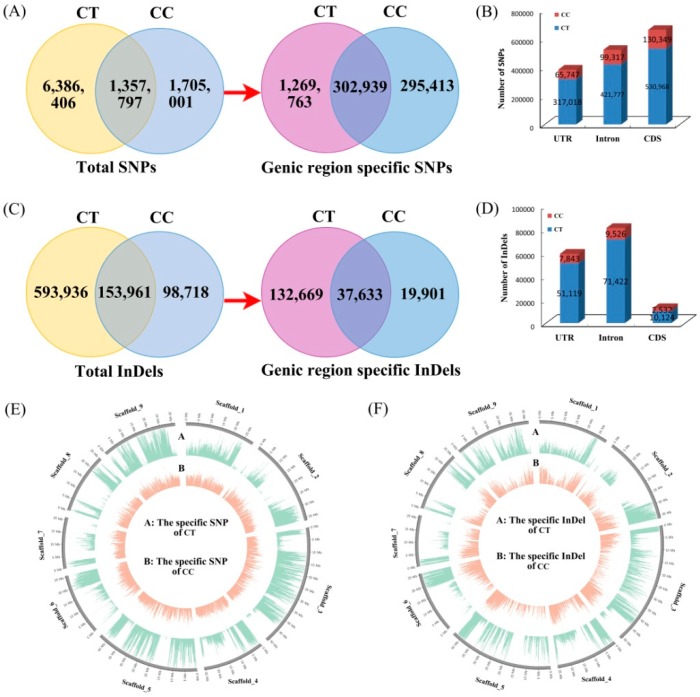
Figure 2.
Venn diagrams of SNPs and InDels in C. trifoliata (CT) and C. clementina (CC). (A) Venn diagrams of total SNPs and specific SNPs; (B) Distribution of SNPs in genic; (C) Venn diagrams of total InDels and specific InDels; (D) Distribution of InDels in genic; (E,F) Landscape of the genome variation of CT versus CC.

