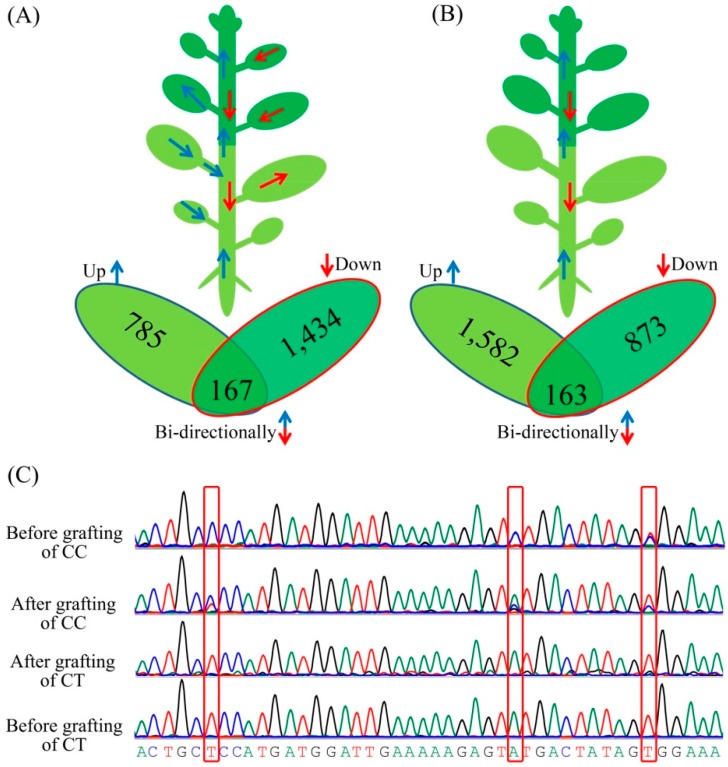
Figure 4.
Diagrams of messenger RNA (mRNA) movement in CT and CC. (A) mRNA movement in the leaves between CT and CC; (B) mRNA movement in the stems between CT and CC. Up and down arrows and their pointing numbers respectively represent the moving directions and numbers of genes producing mRNAs moved into scions (up) or rootstocks (down); (C) The transmitting genes as confirmed by Sanger sequencing.

