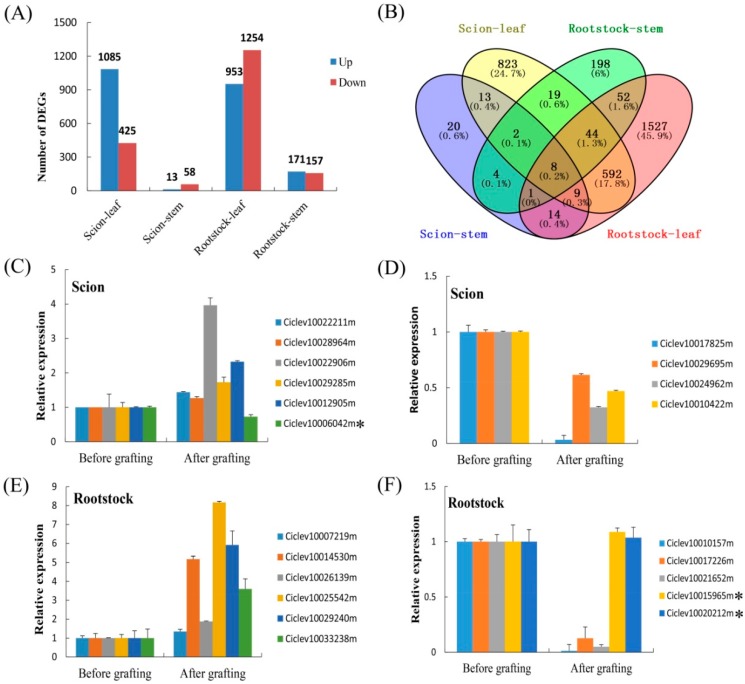
Figure 6.
Analysis of differential expression of genes. (A) The total numbers of differentially expressed genes between scions and rootstocks; (B) Venn diagrams of differentially expressed genes from different tissues of scions and rootstocks. (C) Real-time polymerase chain reaction (PCR) confirmation of the differentially expressed genes (DEGs) in scion. (E,F) Real-time polymerase chain reaction (PCR) confirmation of the differentially expressed genes (DEGs) in rootstock. The asterisk indicates that these genes showed different expression patterns between real-time PCR and RNA sequencing. Relative transcript levels are calculated by real-time PCR with Actin as a standard. Data are means ±standard error (SE) of three separate measurements.

