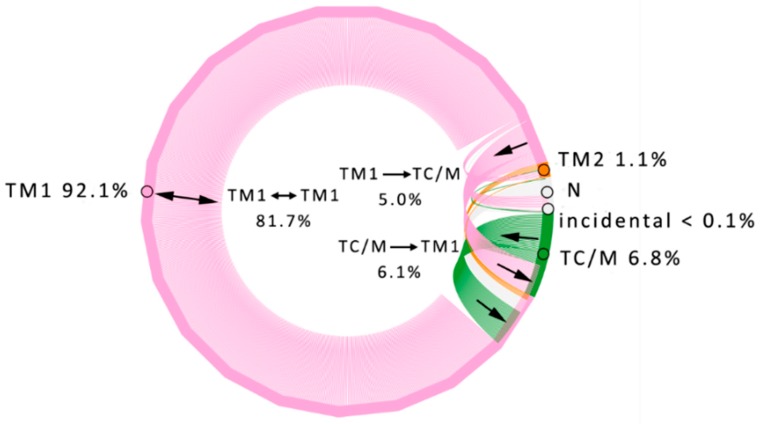
Figure 2.
Water traffic in StEH1. The diagram shows the inter-relationships between identified inlet clusters. Clusters identified in all molecular dynamics (MD) simulations are presented as parts of the circle outline marked with consistent colour-coding: TM1—pink, TC/M—green, TM2—orange. The numbers outside the circle correspond to percentage ratios of inlets identified in particular clusters. N (grey) indicates ends of paths detected inside the protein and does not count for inlets percentage ratios. Lines inside the circle represent water paths coloured according to their entry cluster. Numbers inside the circle show ratios of water molecules travelling between annotated clusters. Please note that the largest number of water molecules enter and exit via single cluster (TM1 ↔ TM1, 81.7%). For pictures clarity, only most abundant paths (>2%, inner circle) are annotated with values and additional small arrows indicate flow direction.

