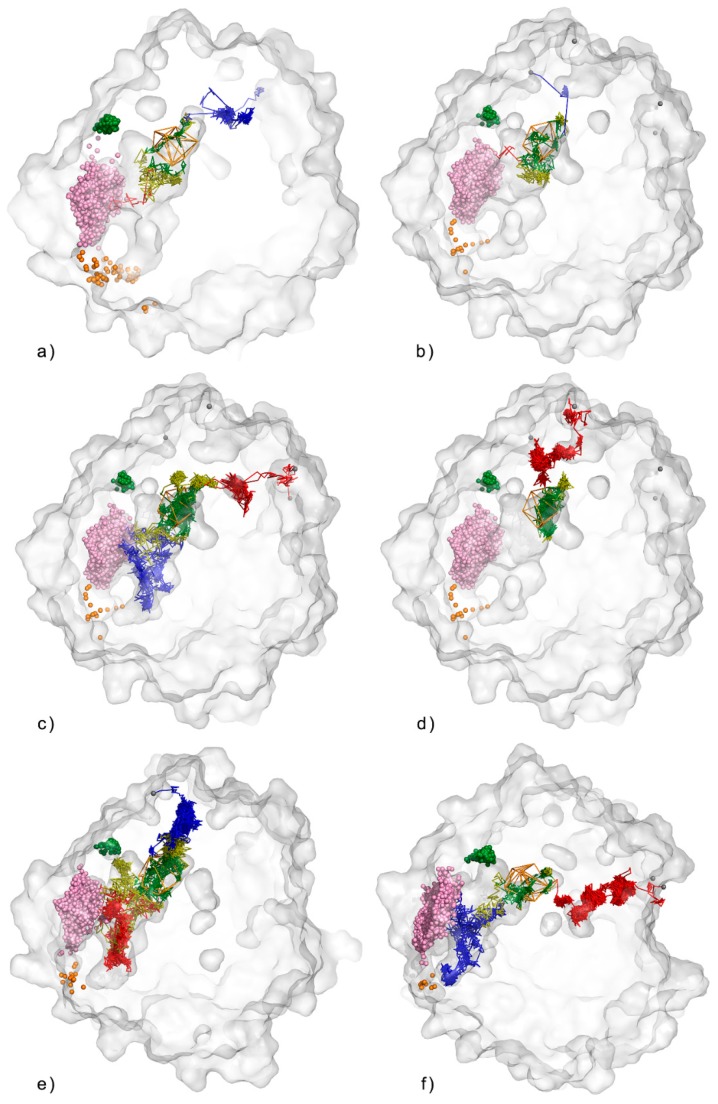
Figure 3.
Detected water outlier trajectories in: (a) 1st; (b–d) 2nd; (e) 3rd and (f) 5th MD simulation. Protein shown us transparent surface, orange wireframe represents object area, Raw paths trajectories are displayed as lines. Red, green and blue lines correspond to incoming, object, and outgoing parts, respectively. Yellow lines represent part of water trajectories which leave active site and re-enter it.

