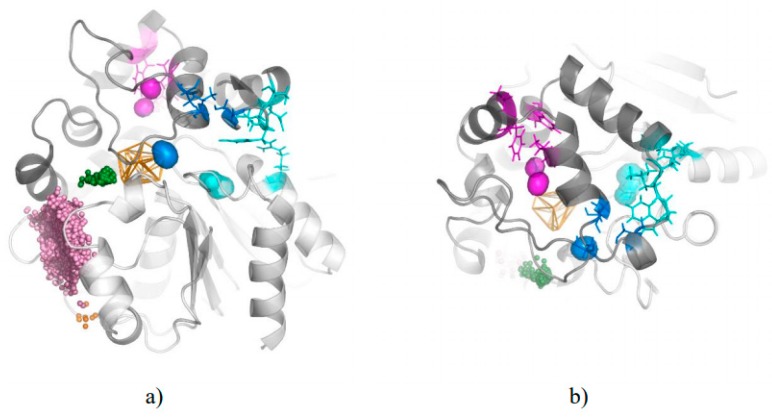
Figure 4.
Localisation of outliers entry/exit regions. The protein side view (a) and top view (b) are shown. The core domain is shown as a light-grey cartoon, the cap domain as a dark-grey cartoon, water molecules inlets are shown as pink, green, and orange spheres for TM1, TC/M, and TM2 clusters, respectively. The cavities (interior surfaces) and residues making outliers entry/exit regions (lines) are shown in blue, cyan and magenta for I, II, and III, respectively.

