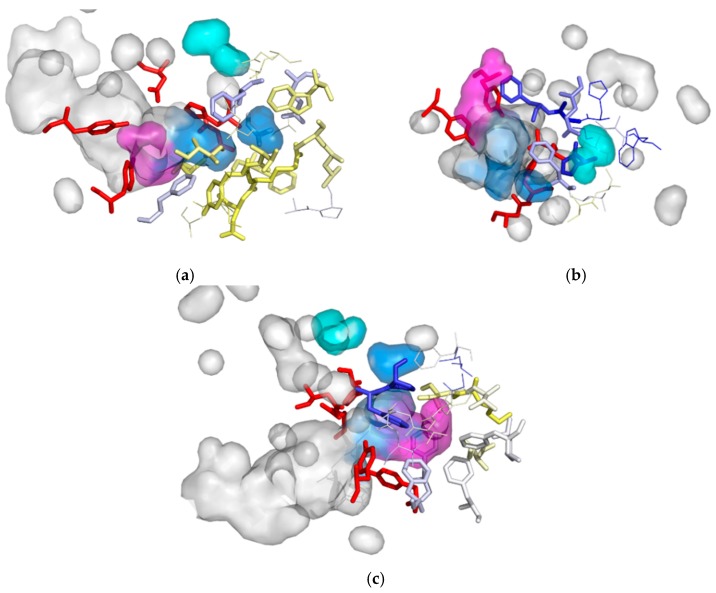
Figure 7.
Variability of residues building cavity I (a), II (b) and III (c). Protein interior surface is shown in transparent grey, cavities interior surface area is shown in transparent blue (cavity I), cyan (cavity II) and magenta (cavity III), active site residues shown as red sticks, the amino acids composing cavities are coloured according to their entropy score and are shown as sticks (for frequently detected) or lines (rarely detected).

