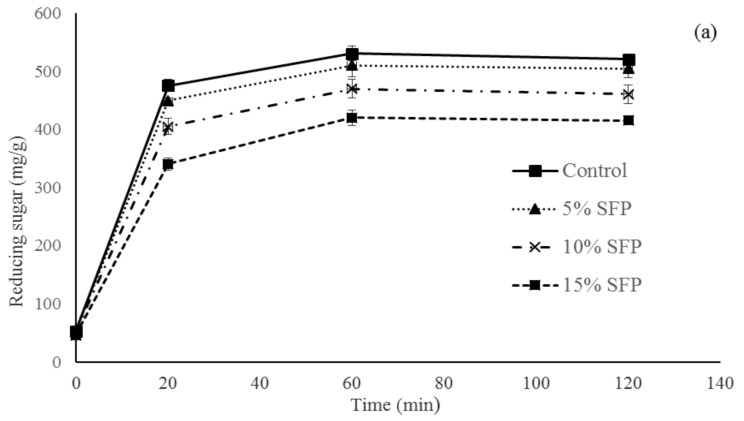
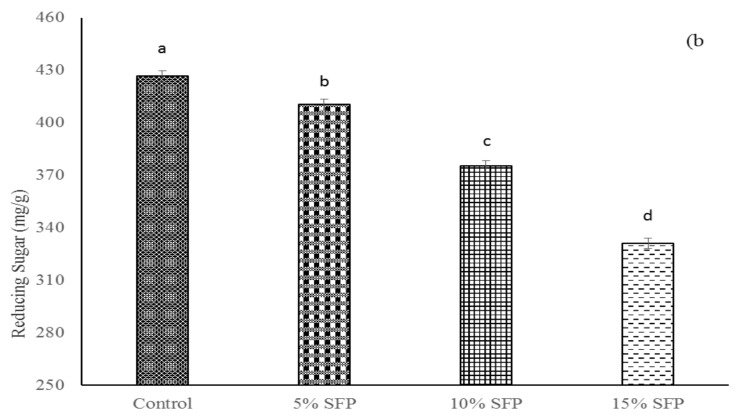
Figure 4.
In vitro starch digestibility of bread. (a) Amount of reducing sugars released (mg/g starch) during in vitro digestion. (b) Values for area under the curve (AUC) compared to the control bread. Control bread; 5% SFP, 10% SFP, and 15% SFP: bread produced with 5, 10, and 15 g salmon fish powder/100 g wheat flour n = 3 ± standard deviation. a–d Values with different superscript letters differ significantly (p < 0.05).


