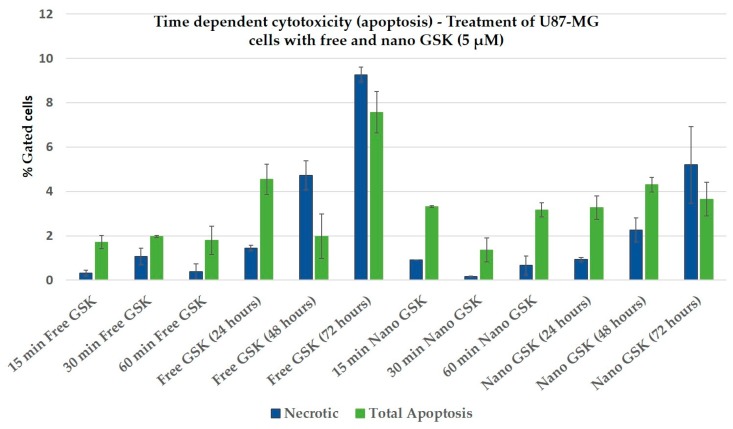
Figure 10.
Bar graphs showing the percentage of apoptotic and necrotic cells following treatment with either free GSK or nano GSK at a drug concentration of 5µM. The percentage of necrotic as well as apoptotic cells from the “no treatment” control were subtracted from all of these treatment arms and plotted here. Error bars indicate standard deviation.

