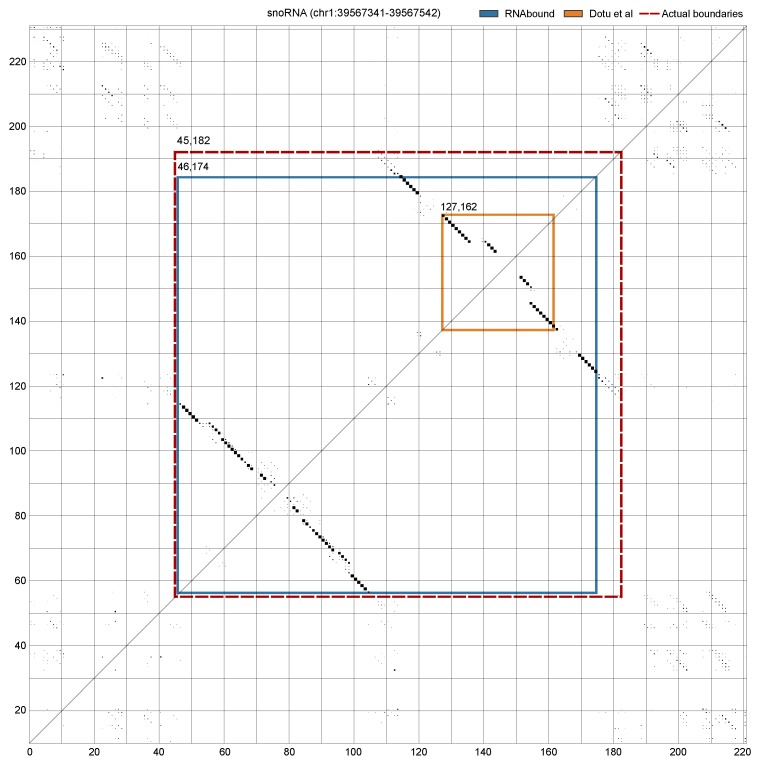
Figure 4.
Dot plot shows the PETfold base pairing probabilities computed from the multiple sequence alignment of a window 200 nucleotides (nts) centered on an H/ACA-box snoRNA (RF00431). Each dot corresponds to base pairing of two bases in the respective positions (along the x- and y-axis) and the size of the dot corresponds to the probability. The bigger the size the higher the pairing probability. Due to the gaps in the multiple sequence alignment, the size of dot plot exceeds the window size 200 nts. The actual and predicted boundaries of the snoRNA are highlighted in the plot: (a) actual boundaries (45, 182—red dashed lines); (b) RNAbound predicted boundaries (46, 174—blue lines); and (c) Dotu et al. prediction (127, 162 orange lines). The boundaries predicted by RNAbound are closer to the actual boundaries (−1 bases short on the left and –8 bases short on the right), whereas the boundaries predicted by the Dotu et al. approach covered only the short substructure and are of −82 and −20 bases short on the left and right, respectively, as compared to the actual boundaries.

