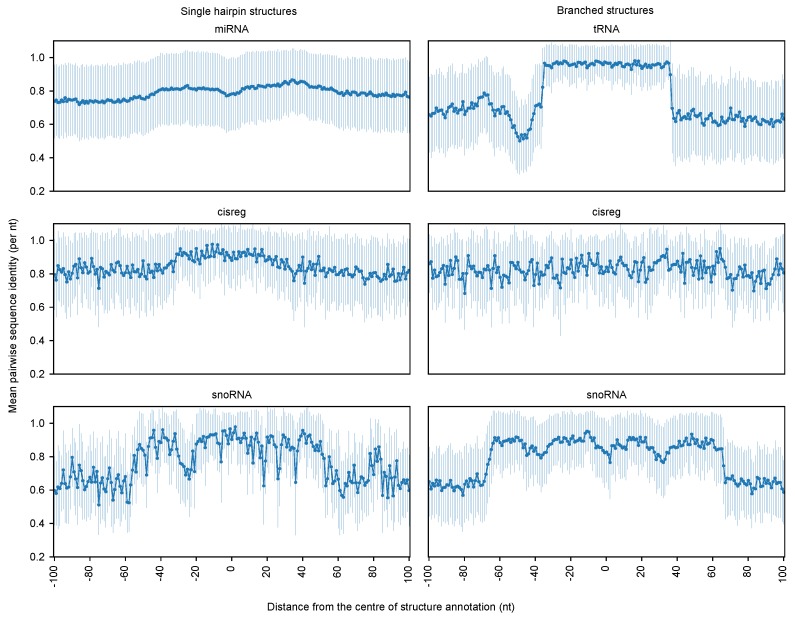
Figure 5.
The mean pairwise sequence identity of each position along the multiple sequence alignment is shown for window size 200 nts. The x-axis represents each position along the multiple sequence alignment, and the y-axis represents the mean pairwise sequence identity computed per position in an alignment corresponding to each Rfam family. The circle indicates the mean of all mean pairwise sequence identities and vertical lines represents the standard deviation for each position on the x-axis. In case of alignments longer than the window size (200 nts), due to gaps introduced in the human sequence, we ignored the gapped columns for the sequence identity calculation. In addition, columns that contain greater than 25% bases as gaps are ignored in this calculation.

