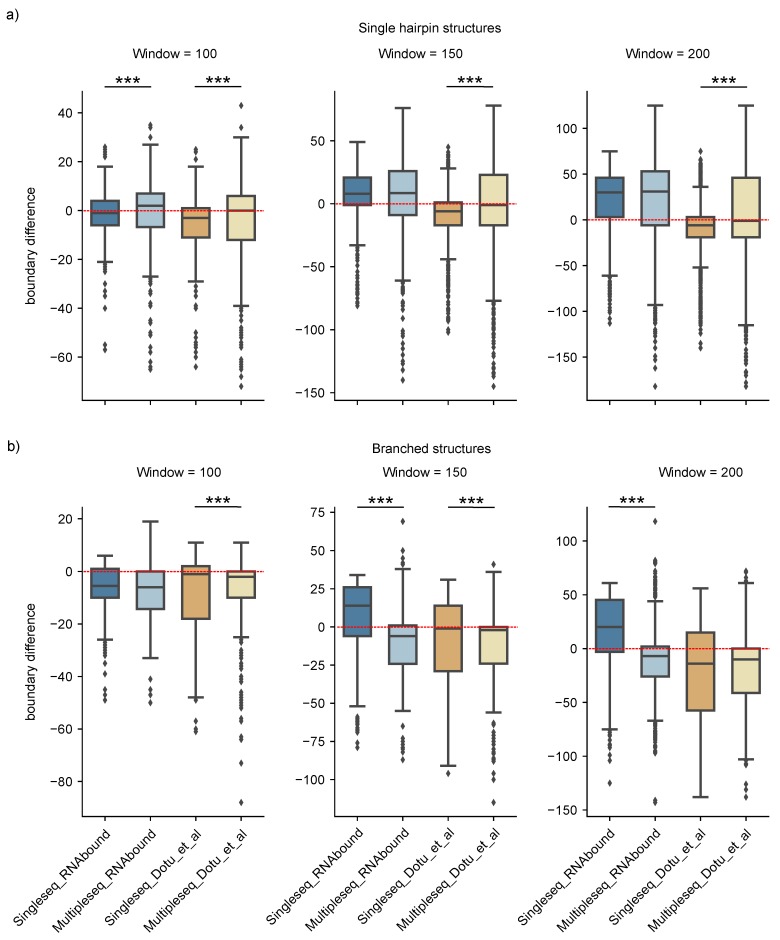
Figure A1.
Comparison of RNAbound and Dotu et al. boundary predictions on single sequence versus multiple sequence alignment for all single hairpin structures (a) and branched structures (b). For simplicity, here we combined the results of and boundary differences under each category represented on the x-axis. The distributions that showed significant difference based on the two-sided Wilcoxon rank-sum test are indicated with asterisk symbol (*** p < 0.001, ** p < 0.01, and * p < 0.05).

