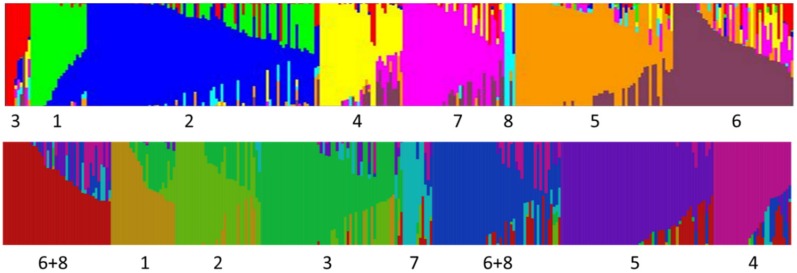
Figure 6.
Structure (top) and fastStructure (bottom) analysis of a snap bean diversity panel for K = 8. Structure analysis conducted with 500,000 burn-in and 750,000 MCMC iterations. Numbers below graph correspond to group numbers in Table 3. Color of bars are arbitrarily assigned to each of eight groups (For Structure bar chart, group 1 = green, 2 = blue, 3 = red, 4 = yellow, 5 = orange, 6 = dark red, 7 = purple and 8 = light blue). Solid bars indicate an individual with no admixture while bars with mixed colors indicate admixture with one or more other groups represented by the appropriate color. Height of the bar is proportional to the amount of admixture.

