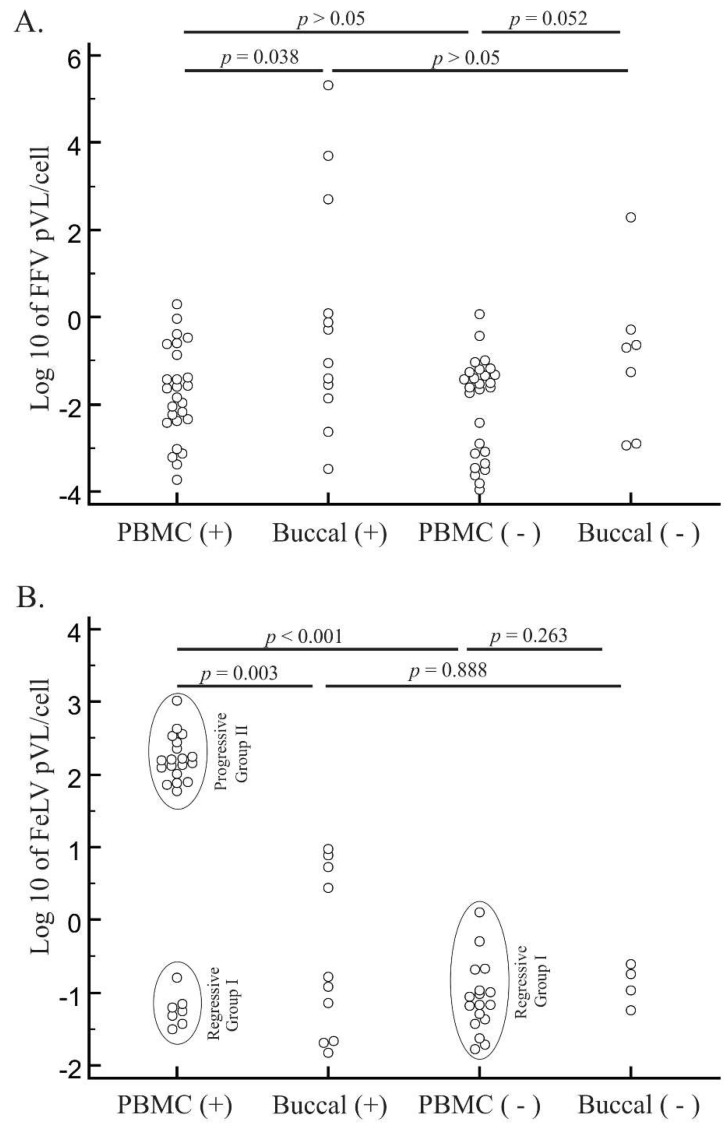
Figure 1.
Distribution of feline foamy virus (FFV) and feline leukemia virus (FeLV) log10 proviral loads (pVLs) in blood and oral specimens. FFV (A) and FeLV (B) pVLs were measured by quantitative PCR of specimens with nested PCR-positive and -negative test results from domestic cats from Brazil. PCR-positive and -negative cat samples in peripheral blood mononuclear cell (PBMC) or buccal specimens are presented on the x-axis. Horizontal lines above each graph depict statistical comparisons between the pVL of specific animal groups or specimen types (Student’s t tests) with associated probability (p) values shown. Ellipses in (B) represent different cat groups of FeLV infection outcomes (regressive or progressive).

