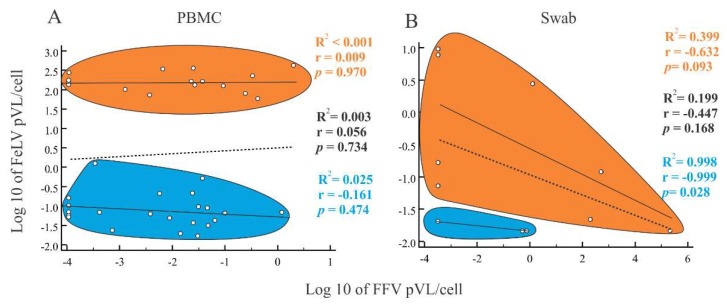
Figure 3.
Spearman correlation analysis between feline leukemia virus (FeLV) and feline foamy virus (FFV) log10 proviral loads (pVLs) on blood and oral specimens. Correlations were tested in both peripheral blood mononuclear cells (PBMCs) (A) and buccal swab specimens (B). Vertical and horizontal axes represent FeLV and FFV pVLs, respectively. Each open circle represents a sample for which pVL was measured for both viruses. Orange and blue ellipsoids represent FeLV progressive and regressive individuals, respectively. Correlation coefficients (R2) and probabilities (p-values) are provided for each group (progressive and regressive) and for all samples together. They are represented in the graph by lines. Dotted lines represent the correlation among all samples, both progressive and regressive. For PBMCs, progressive and regressive cats had FFV and FeLV pVLs with weak correlation (R2 < 0.001, p = 0.970 and R2 = 0.025, p = 0.474, respectively). pVLs in buccal swab samples of progressive and regressive cats were inversely correlated (R2 = 0.399, p = 0.093 and R2 = 0.998, p = 0.028, respectively).

