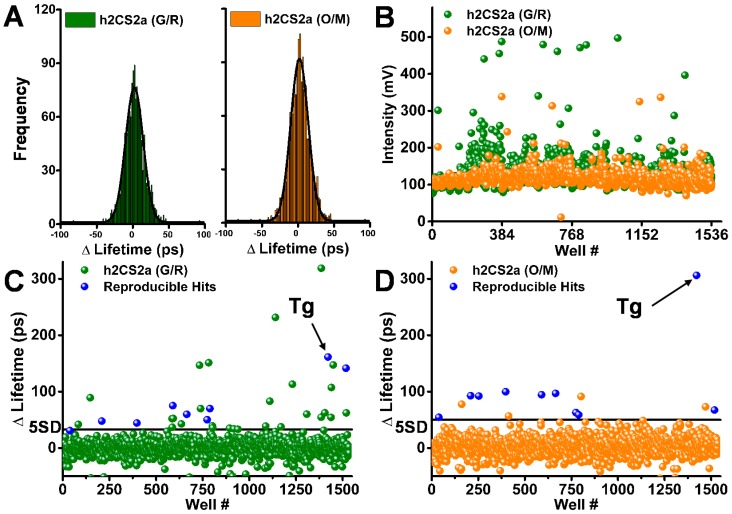
Figure 4.
LOPAC library pilot screens for 2-color SERCA2a in live cells: (A) Histograms show distribution of observed lifetime changes from single screens, each fit to a Gaussian distribution to determine the SD (~8 ps for G/R and 11 ps for O/M). (B) Peak intensity (mV) for false-positive hit flagging. Bottom: lifetime change in a single 1536-well screen for G/R (C) and O/M (D). Known SERCA inhibitor thapsigargin (10 μM) shown by arrow. Reproducible hits (blue) were identified in three separate screens.

