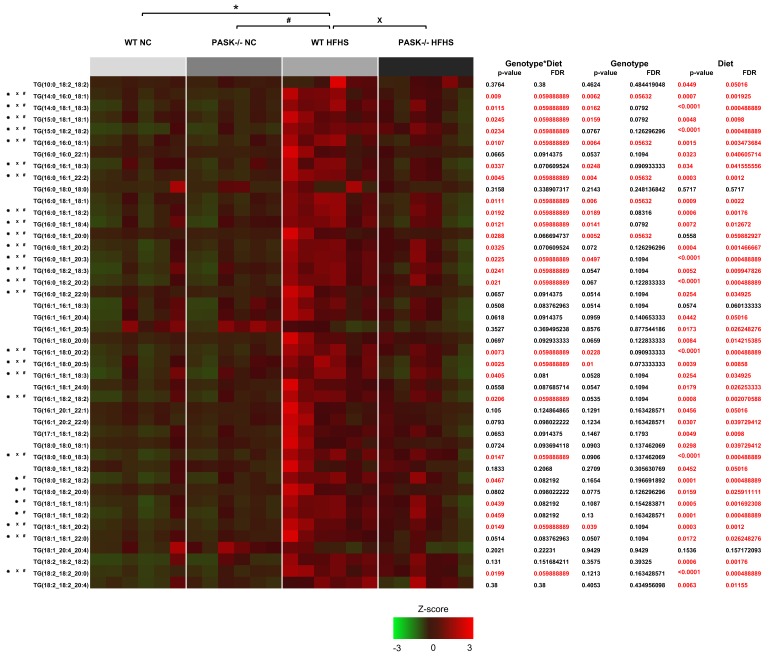
Figure 4.
LC/MS triglyceride analysis of WT and PASK−/− male mice on NC and HFHS reveal significant changes in individual triglycerides. A heat map LC/MS triglyceride analysis from male WT and PASK−/− mice placed on a NC and HFHS diet (n = 6 for each of 4 sample groups) *, #, or X, p < 0.05 when analyzed by two-factor ANOVA and Tukey post-hoc test. Two-factor (genotype and diet) and one-factor (genotype or diet) interaction analysis is provided in a table on the right with p-values and false discovery rates (FDR) given. Significant p-values (p < 0.05) are shown in read, with alternative FDR q-value cutoff (p < 0.0599) provided in red for comparison.

