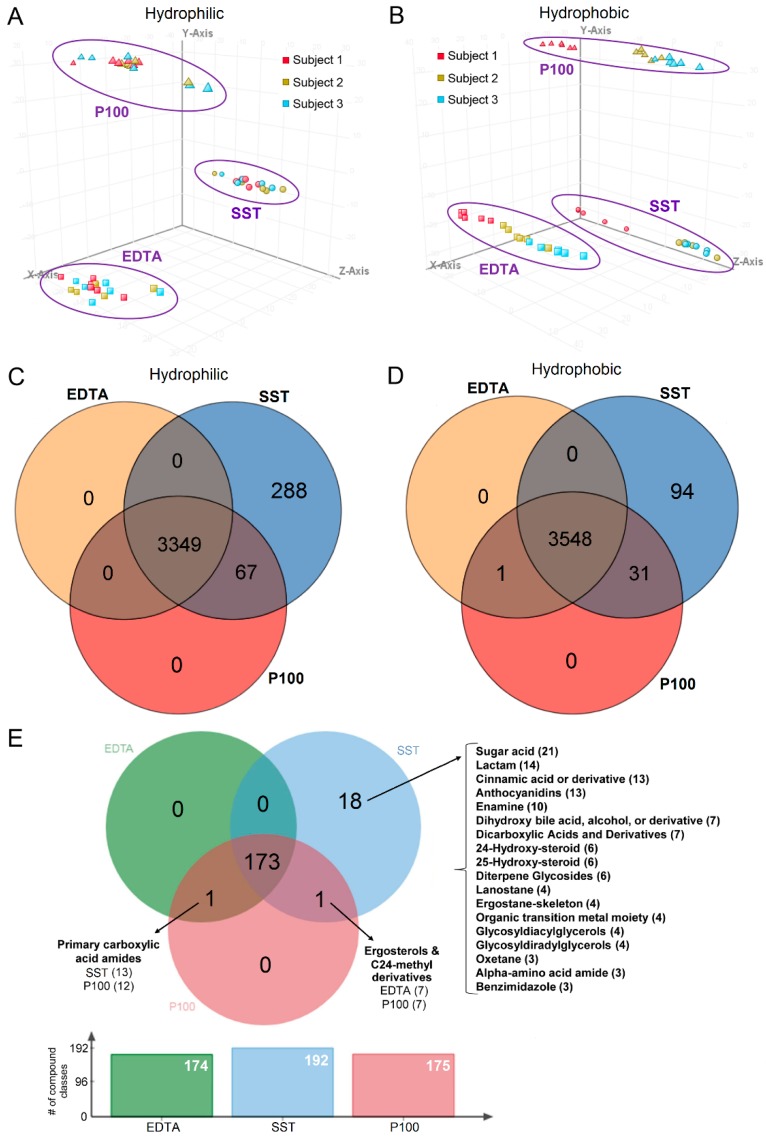
Figure 1.
Comparison of sample tubes. (A) PCA plot on data shows clustering on tube type in the hydrophilic fraction. x-axis: PC1, 18.93%; y-axis: PC2, 16.83%; z-axis: PC3, 4.52%. (B) PCA plot on samples shows clustering on tube type and subject in the hydrophobic fraction. x-axis: PC1, 23.56%; y-axis: PC2, 20.9%; z-axis: PC3, 4.2%. PCA was performed using all metabolites prior to filtering and statistical analysis. ∆ P100, ○ SST, □ EDTA. (C) Overlap of metabolites in the hydrophilic fraction. (D) Overlap of metabolites in the hydrophobic fraction. Compounds were filtered for presence in 50% of at least one time point in each tube. (E) Venn diagram of taxonomy showing the overlap of compound classes that passed enrichment analysis based on FDR ≤ 0.05. The overlapping intersection shows the name of the unique compound classes, the tube type and the number of compounds from that compound class. The unique section lists the number of compound classes in SST and the number of compounds detected in that class in parenthesis.

