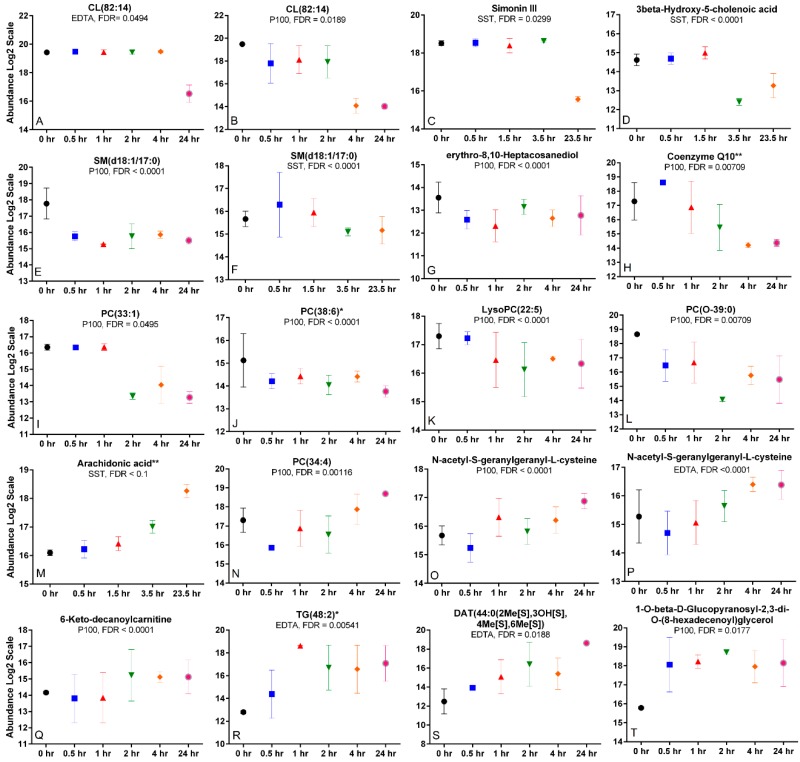
Figure 3.
Metabolites affected by time. (A–L) Compounds whose abundance decreased and (M–T) compounds whose abundance increased with time in the indicated blood collection tube. Processing time differences are based on Repeated Measures ANOVA with FDR ≤ 0.1. * indicates identified by MSMS fragments to the NIST spectral library. ** indicates identified using standards and MSMS fragmentation. Error bars represent standard error of the mean, n = 3 subjects per time point.

