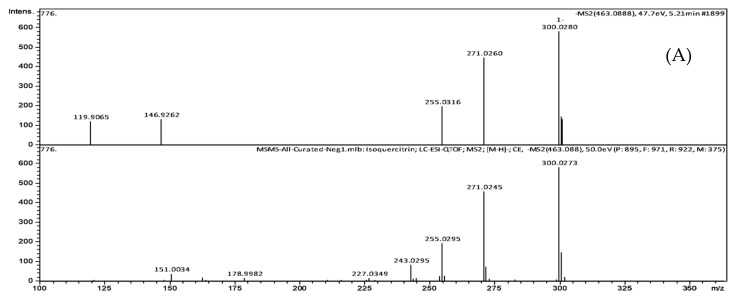
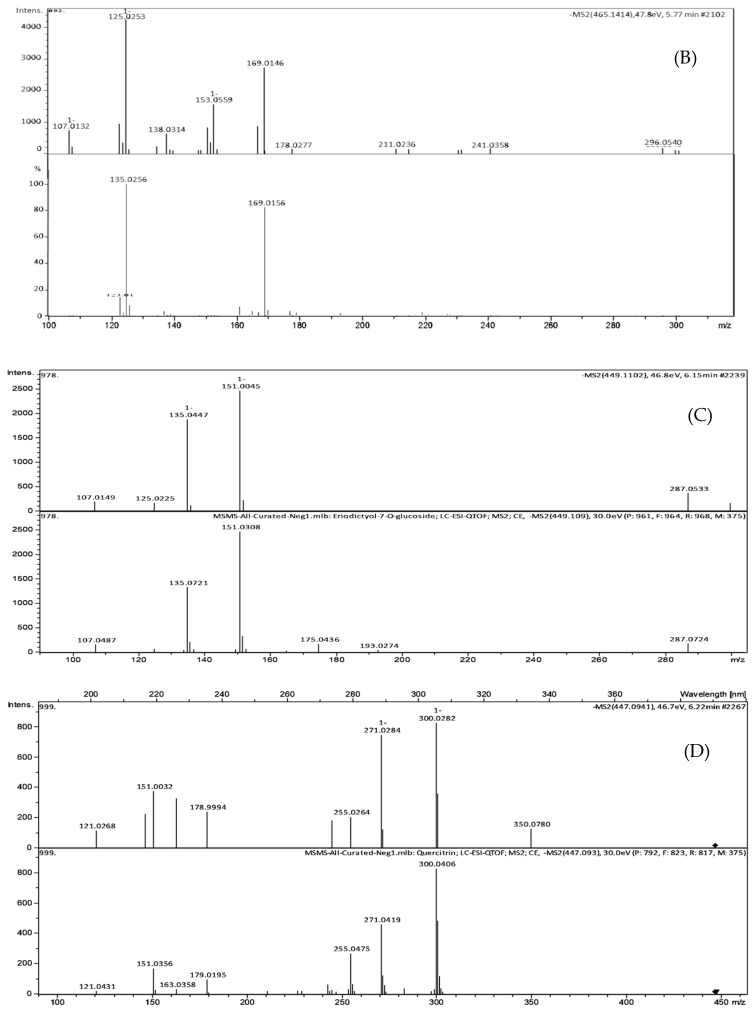
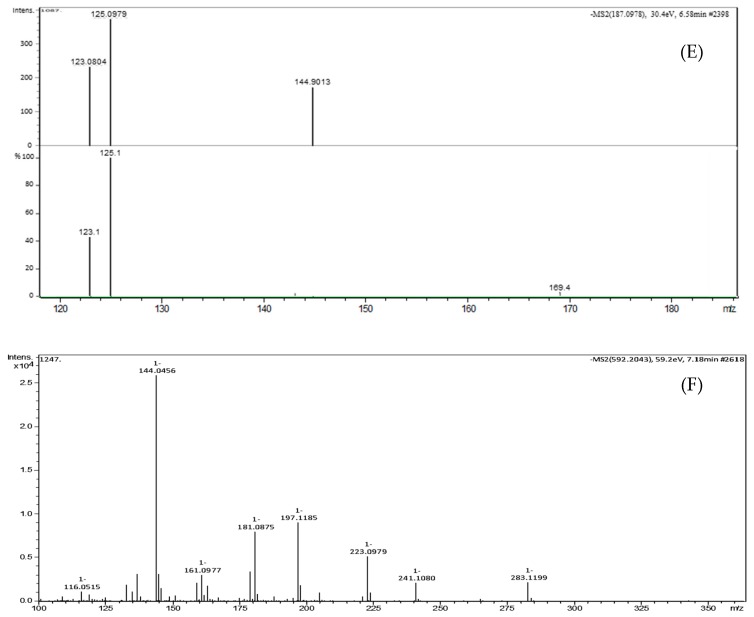
Figure 5.
Head-to-tail spectral comparisons between the experimental MS/MS spectra and the referenced library MS/MS spectra. (A) Peak 1: Isoquercitrin, (B) peak 2: a catechin derivative; (C) peak 3: eriodictyol-7-O-glucoside, (D) peak 4: quercitrin, (E) peak 5: azelaic acid, (F) peak 6: glansreginin A. In each comparison, the experimental MS/MS spectra (upper) and the referenced library MS/MS spectra (lower). Since compound 6 was tentatively identified by MetFrag in silico interpretation of the MS/MS spectrum, head-to-tail of this spectral comparison did not show.


