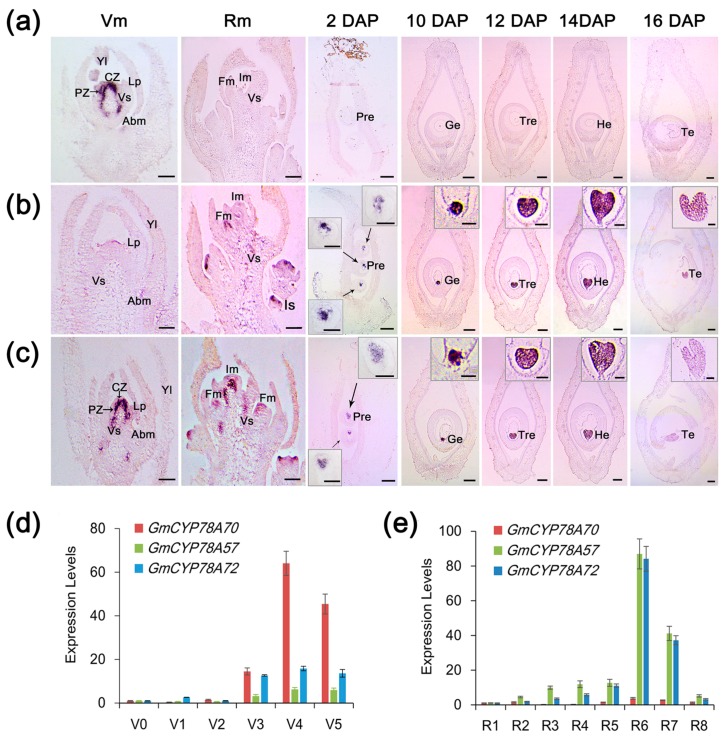
Figure 3.
Spatiotemporal expression patterns of GmCYP78As. (a–c) In situ hybridizations of GmCYP78A70, GmCYP78A57 and GmCYP78A72 were performed respectively in the vegetative meristem (Vm), reproductive meristem (Rm), and the carpel and young pod. Scale bars = 100 μm. For the boxed insets of (b,c) the scale bars = 20 μm. (d) Expression levels of GmCYP78As at each stage of the vegetative phase (V0–V5). (e) Expression levels of the GmCYP78As at each stage of the reproductive phase (R1–R8). Expression levels at the V0/R1 stage were set to 1, while those at other stages were adjusted accordingly. Data shown are mean ± SE (n = 3, biological replicates). CZ, central zone; PZ, peripheral zone; Abm, axillary bud meristem; Vs, developing vascular strand; Fm, floral meristem; Im, inflorescence meristem; Is, inflorescence stem; Pre, proembryo; Ge, global embryo; Tre, transition embryo; He, heart embryo; Te, torpedo embryo; DAP: days after pollination.

