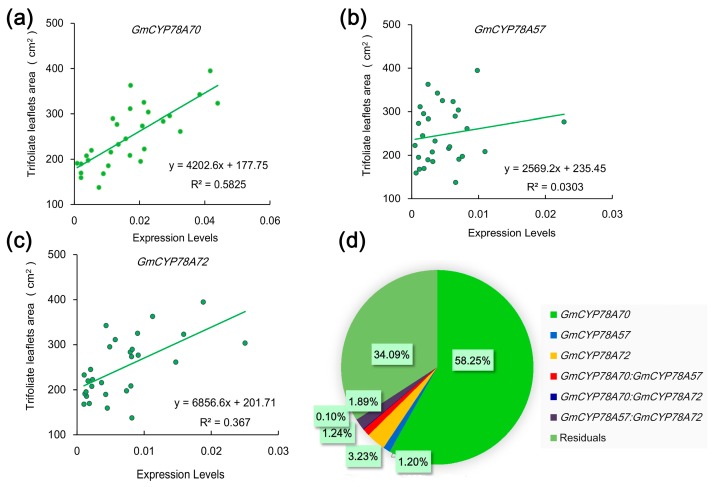
Figure 5.
Relationships between the leaf area and the expression level of GmCYP78As in leaves. (a–c) Linear regressions between the leaf areas and the expression levels of GmCYP78A70, GmCYP78A57 and GmCYP78A72, respectively. Data shown are mean ± SE (n = 3). (d) The respective contribution of GmCYP78As expression to leaf area (percentage of variation explained). For the statistical analysis of relationship between gene expression level and trait, a linear model was fitted with the R function lm. The model was fitted with the following terms: “trait ~ GmCYP78A70 + GmCYP78A57 + GmCYP78A72 + GmCYP78A70:GmCYP78A57 + GmCYP78A70:GmCYP78A72 + GmCYP78A57:GmCYP78A72”, where the individual effect of each gene and the interaction effects of gene pairs were included.

