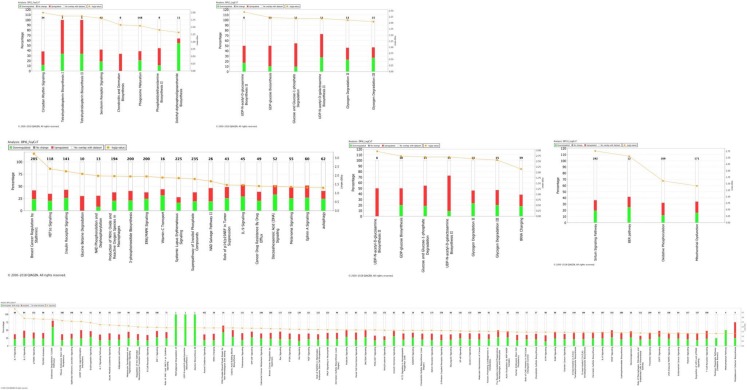
Figure 1.
Significantly enriched pathways identified through the Ingenuity Pathway Analysis among the differentially expressed genes by timepoint and genetic line. (A) Fayoumi at 2 days post-infection (dpi), (B) Leghorn at 2 dpi, (C) Fayoumi at 6 dpi, (D) Leghorn at 6 dpi, (E) Fayoumi at 10 dpi, and (F) Leghorn at 10 dpi. The number of genes in each pathway is shown in black, up-regulated (red) and down-regulated genes (green) within the pathway, and the significance value calculated as the −log(p-value) is depicted as an orange line.

