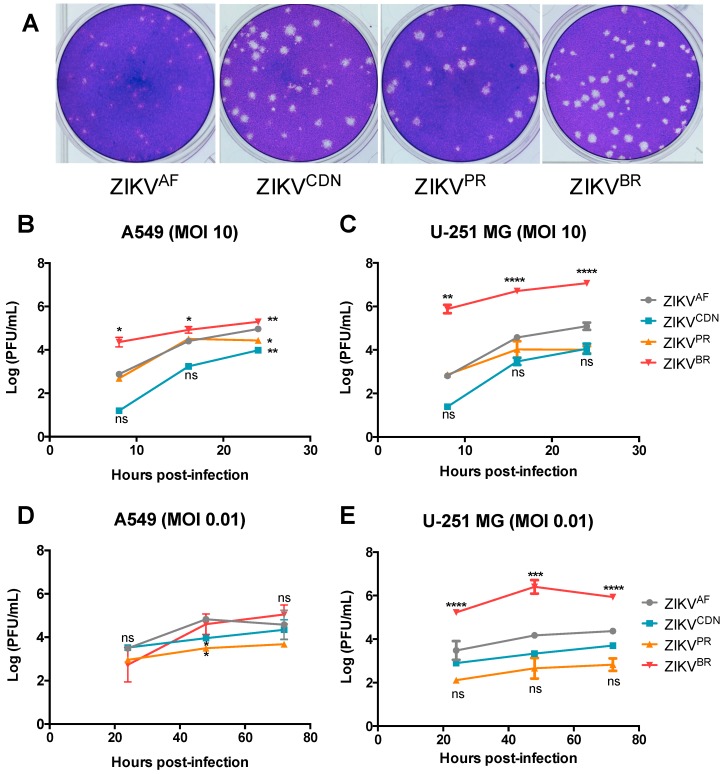
Figure 1.
ZIKV isolates demonstrate unique plaque morphology and different growth kinetics in A549 and U-251 MG cell lines. (A) Representative images of Vero cell plaque assays of the indicated ZIKV isolates. (B–E) Cell culture supernatants were collected at the indicated time points and viral titer was determined by plaque assay. (B) A549 and (C) U-251 MG cells were infected with ZIKV at MOI = 10. (D) A549, and (E) U-251 MG cells were infected with ZIKV at MOI = 0.01. Values represent mean ± SD of at least three independent experiments. Asterisks indicate significant differences in viral titer relative to ZIKVAF: * p < 0.05, ** p < 0.01, *** p < 0.001, **** p < 0.0001.

