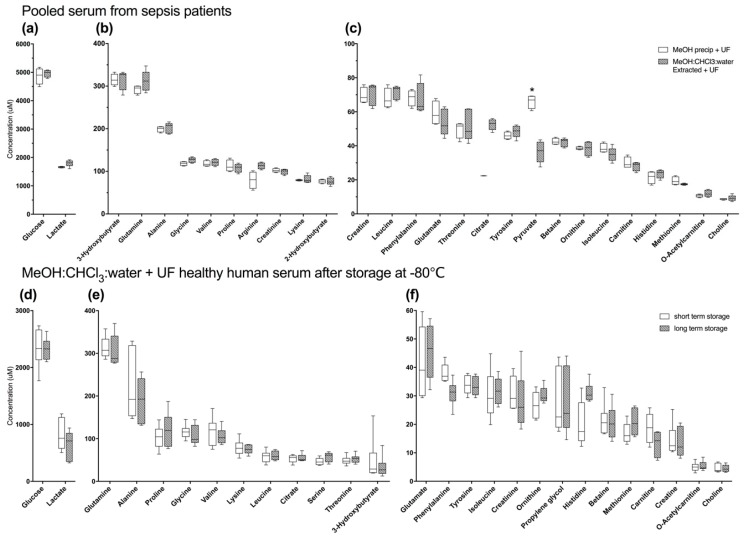
Figure 3.
Differences in macromolecule removal strategies were not evident in pooled technical replicates of human serum from patients with sepsis (a–c) suggesting that sample collection techniques may influence metabolite recovery (n = 4 for MeOH ppt +UF, n = 5 for MeOH:CHCl3:water ext +UF). All samples were also ultra-filtered. Long-term storage at −80 °C did not result in changes to detected metabolomes (d–f). Box plots represent the interquartile range of all samples in each group (n = 6 for both storage conditions) with the cross-bar being the median and the whiskers representing minimum and maximum concentrations. (a,d) show glucose and lactate; (b,e) are high abundance metabolites with concentrations <400–100 μM; and (c,f) are low-abundance metabolites with concentrations <100 μM. * p ≤ 0.05 by unpaired Student’s t-test of normalized concentration data.

