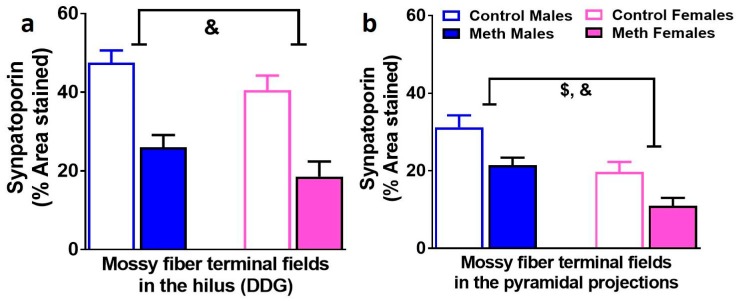
Figure 5.
Mossy fiber tracts in the DG are distinctly altered in males and females. (a,b) Quantitative analysis of the density measures in the hilus (a) and CA3 pyramidal projections (b). Data shown are represented as the mean ± SEM. n = 12–19 males, n = 8–13 females. &, main effect of reinstatement; $, main effect of sex by two-way ANOVA.

