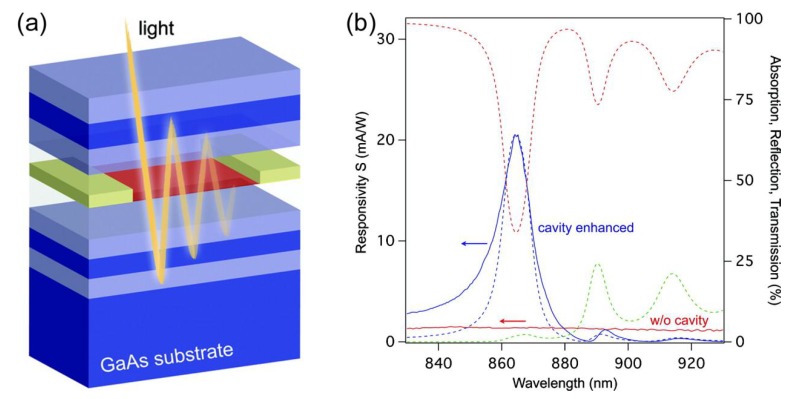
Figure 8.
(a) Schematic drawing of the graphene microcavity photodetector. Distributed Bragg mirrors form a high finesse optical cavity. (b) Spectral response of the bilayer graphene device. The dashed lines show calculation results: reflection R (red), transmission T (green), and absorption A (blue). The solid lines are measurement results: photoresponse for the device with cavity (blue) and photoresponse for the device without cavity (red). Reproduced from reference [45], with permission from American Chemical Society, 2012.

