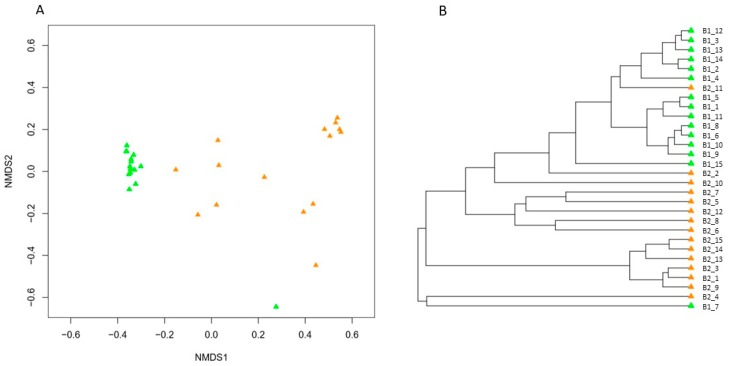
Figure 2.
(A) Non-metric multidimensional scaling (NMDS) ordination (stress value = 0.09) based on Bray–Curtis similarities depicting the gut (midgut and ileum) bacterial community composition of indoor-reared bumblebee queens (Bombus terrestris) before (green; n = 15) and after hibernation (orange; n = 15). The distance between different points on the plot reflects the similarity level in bacterial community composition: the more similar the bacterial communities, the smaller the distance between the points. (B) UPGMA (Unweighted pair group method with arithmetic mean) dendrogram visualization of the clustering analysis.

