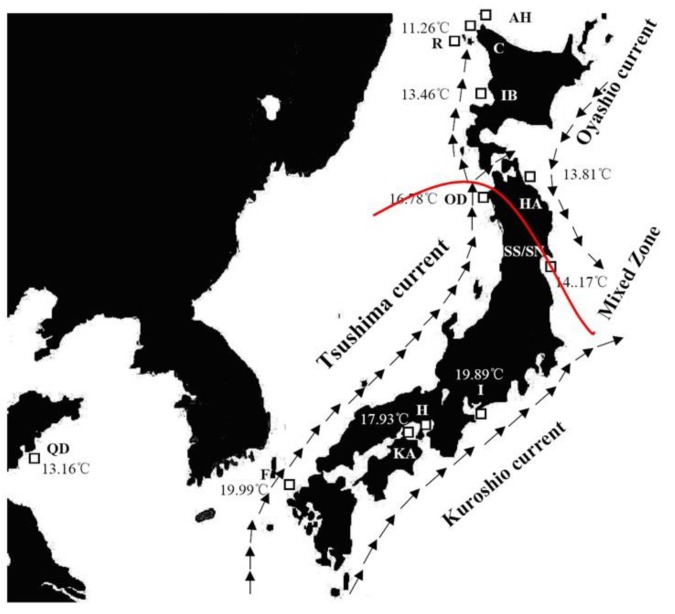
Figure 1.
Map of the study area depicting sample locations, schematic map of currents, and the annual sea temperature. The samples ID in map are listed in Table 1. The predicted boundary between the northern and southern clades is represented on the map with a red line.

