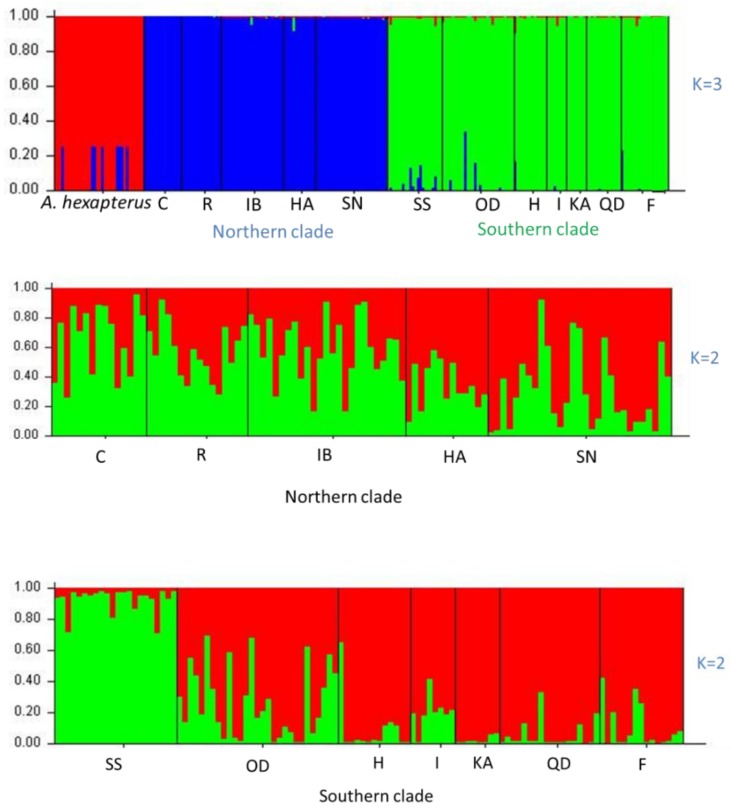
Figure 2.
Spatial genetic structure for all individuals and northern and southern clades according to a Bayesian assignment probability analysis using the program STRUCTURE 2.3. K = 3 for the total data. K = 2 for northern and southern clades appeared to be the optimal number of clusters by showing the greatest ΔK. The samples ID are listed in Table 1.

