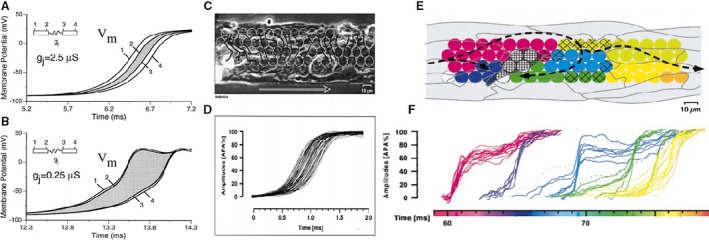
Figure 6.

(A and B) Calculated effect of a decrease in gap junction conductance on conduction from cell to cell. (A) Normal gap junction conductance is 2.5 μS. (B) Gj is reduced to 0.25 μS. For normal coupling (A) intercellular conduction delay at the gap junction is approximately equal to the intracellular conduction time. A tenfold decrease in gap conductance (B) increases the intercellular delay and decreases the intracellular conduction time drastically, resulting in gap junction dominance of macroscopic conduction velocity. (Shaw and Rudy 1997). (C) and (D) Experimental measurement of microscopic conduction under control conditions. (C) Phase contrast image of the preparation with superimposition of the white circles indicating the location of the photodetectors. Stimulation on the left side. Conduction velocity 43 cm/sec. (D) Superimposition of all action potentials measured by the photodetectors (Rohr et al. 1998). (E) and (F): Action potential propagation during marked cell‐to‐cell uncoupling in a synthetic strand of neonatal rat myocytes. (E) image of a segment of the strand with colored circles denoting position of light‐measuring diodes. Path followed by the excitation (F) action potential recorded by each diode, shows clustering of upstrokes in groups. Within each group excitation is practically simultaneous; propagation delays up to 5 msec occur between groups. Note that a number of cells are excited almost simultaneously and that complete conduction block occurs in the cell marked by the rectangular hatching. Delays are confined to cell borders (Rohr et al. 1998). With permission.
