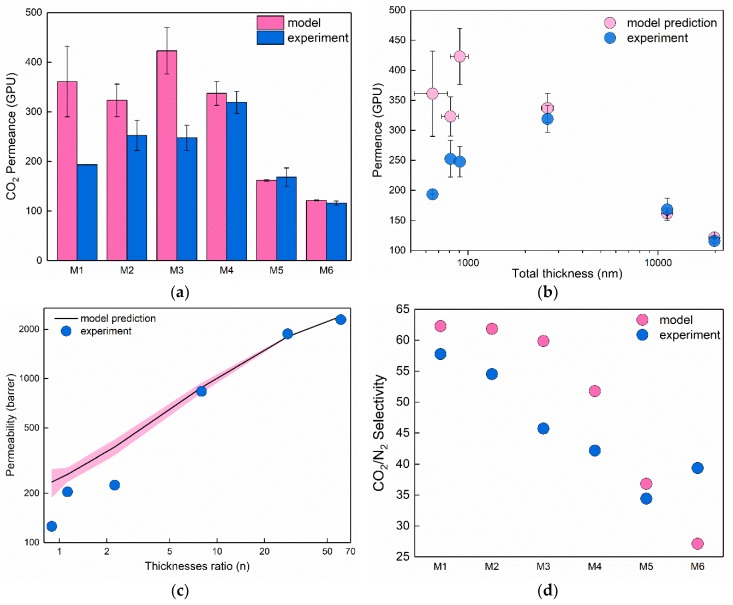
Figure 7.
Comparison of the experimentally measured membrane performance with predictions calculated by resistance model: (a) CO2 permeance of fabricated membranes M1–M6; (b) CO2 permeance as a function of total membrane thickness; (c) CO2 permeability dependence on thickness ratio n (pink shading shows 95% confidence interval of prediction considering the error of thickness measurement); (d) CO2/N2 selectivity of fabricated membranes M1–M6.

