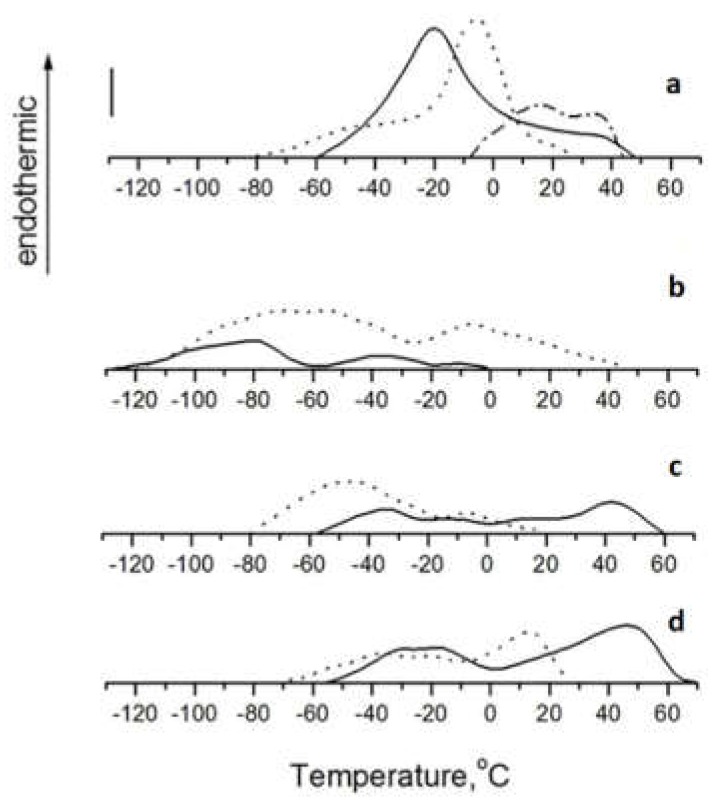
Figure 2.
DSC thermograms of betaine lipid DGTS (a) and glycolipids MGDG (b), DGDG (c), SQDG (d) from the green thalli of Ulva lactuca inhabiting the Sea of Japan (solid curve), the green thalli of algae inhabiting the Adriatic Sea (dotted curve) and the bleached thalli of algae inhabiting the Adriatic Sea (dash-dotted curve). The vertical bar represents 0.5 mW. The scanning rate, 16 °C/min. The sample weight, 10 mg. Each sample was scanned at least three times.

