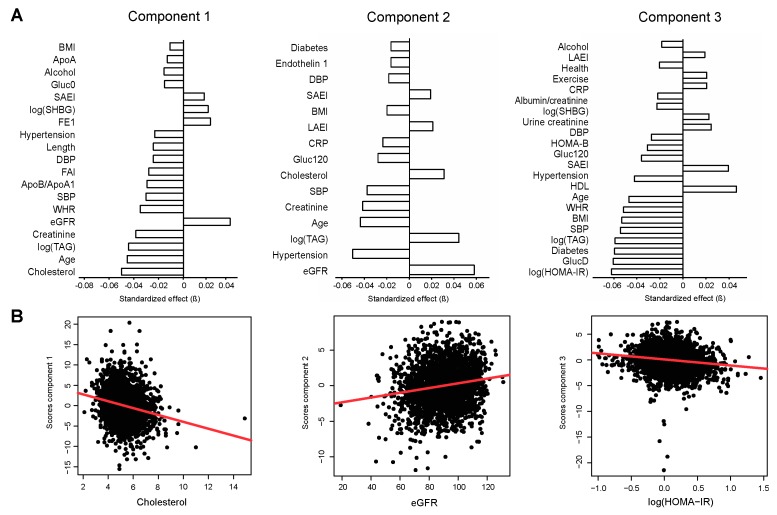
Figure 2.
Principal components associate with distinct phenotypic features. (A) Associations of phenotypic traits with sample scores along the first three principal components (standardized regression coefficients, β; q < 0.05). (B) Cholesterol associates strongly with component 1 (left panel), eGFR with component 2 (middle panel), and HOMA-IR with component 3 (right panel). The linear regression line is shown in red. Abbreviations: Alcohol, alcohol intake gram/week; ApoA, apolipoprotein A1; ApoB, apolipoprotein B; CRP, c-reactive protein; DBP, diastolic blood pressure; eGFR, estimated glomerular filtration rate; Gluc0, fasting glucose; Gluc120, 120 min oral glucose tolerance test (OGTT) glucose level; HOMA-B, homeostasis model assessment of beta-cell function; HOMA-IR, homeostasis model assessment of insulin resistance; LAEI, large artery elasticity index; SAEI, small artery elasticity index; SBP, systolic blood pressure; SHBG, sex hormone binding globulin; TAG, triacylglycerides; WHR, waist/hip-ratio.

