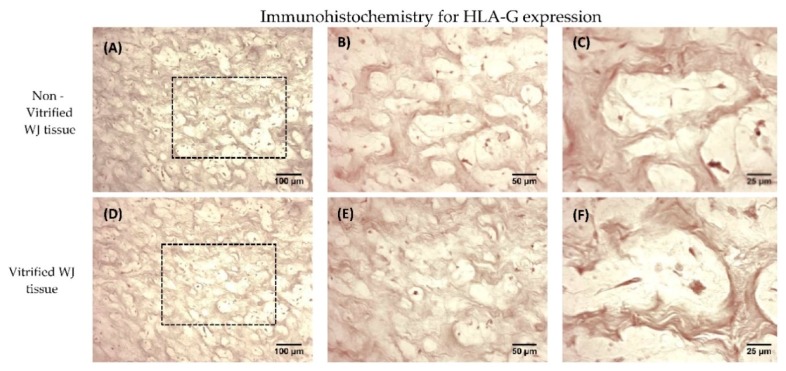
Figure 4.
HLA-G expression in WJ tissue. Immunohistochemistry results regarding the HLA-G expression in non-vitrified (n = 5) WJ tissue (A–C). Immunohistochemistry results regarding the HLA-G expression in vitrified (n = 5) WJ tissue (D–F). The black boxes in 10× images (A,D) highlights the region that was magnified in images B,C,E,F. Images A,B were acquired with original magnification 10×, scale bars 100 μm. Images B,E were acquired with original magnification 20×, scale bars 50 μm. Images C,F were acquired with original magnification 40×, scale bars 25 μm.

