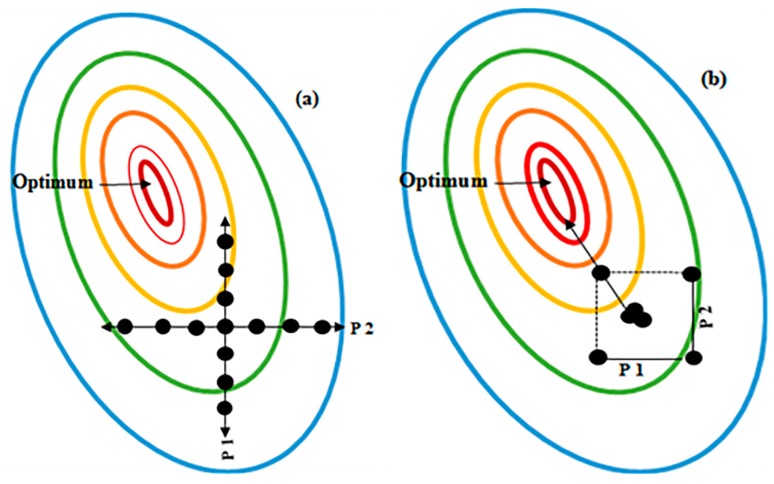
Figure 2.
Comparison between Design of Experiments (DoE) and One-Factor-at-A-Time (OFAT) by examining the effect of two parameters, P1 (Parameter 1) and P2 (Parameter 2). (a) OFAT is performed using more experiments than DoE (each black dot represents an experiment) and does not identify the true optimum (indicated as a red oval). However, with the DoE approach (b) fewer experiments are used and the likelihood of finding the optimum conditions (in red) for the process being studied is high. With DoE the combined or interaction effect of P1 and P2 on the response can be identified and measured. The ovals indicate production yields, blue indicates the lowest yields, whereas red indicates highest yields, where the optimum is found. The DoE approach also identifies a pathway to the optimum response (indicated by the arrow).

